What it does
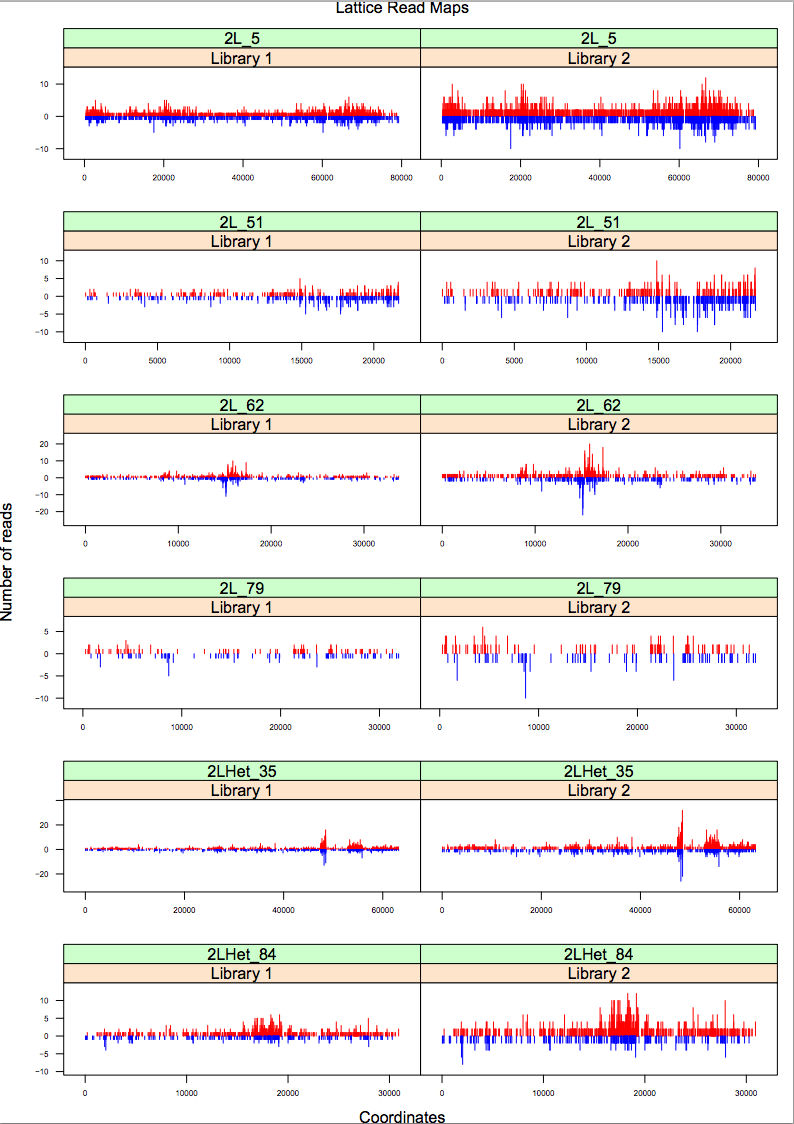
Takes one or more alignment files (BAM, SAM or tabular bowtie output) as input and produces a "Readmap", where by default for each "chromosome" the position of the read is recorded on the x-axis, and the y-axis indicates the number of reads per position. Reads that map in sense are on the top, reads that map antisense are on the bottom.
'''TIP''' The input data can be produced using the sRbowtie tool.
'''Example'''
Query sequence:: For a SAM file as the following:
5 16 2L_79 24393 255 17M * 0 0 CCTTCATCTTTTTTTTT IIIIIIIIIIIIIIIII XA:i:0 MD:Z:17 NM:i:0
11 0 2R_1 12675 255 21M * 0 0 AAAAAAAACGCGTCCTTGTGC IIIIIIIIIIIIIIIIIIIII XA:i:0 MD:Z:21 NM:i:0
2 16 2L_5 669 255 23M * 0 0 TGTTGCTGCATTTCTTTTTTTTT IIIIIIIIIIIIIIIIIIIIIII XA:i:0 MD:Z:23 NM:i:0
produce a plot like this:

| height: | 800 |
|---|---|
| width: | 500 |