What it does
This tool is useful for assessing the strength of a ChIP (i.e. how clearly the enrichment signal can be separated from the background) and is based on a method described in Diaz et al. (2012) Stat Appl Genet Mol Biol 11(3).
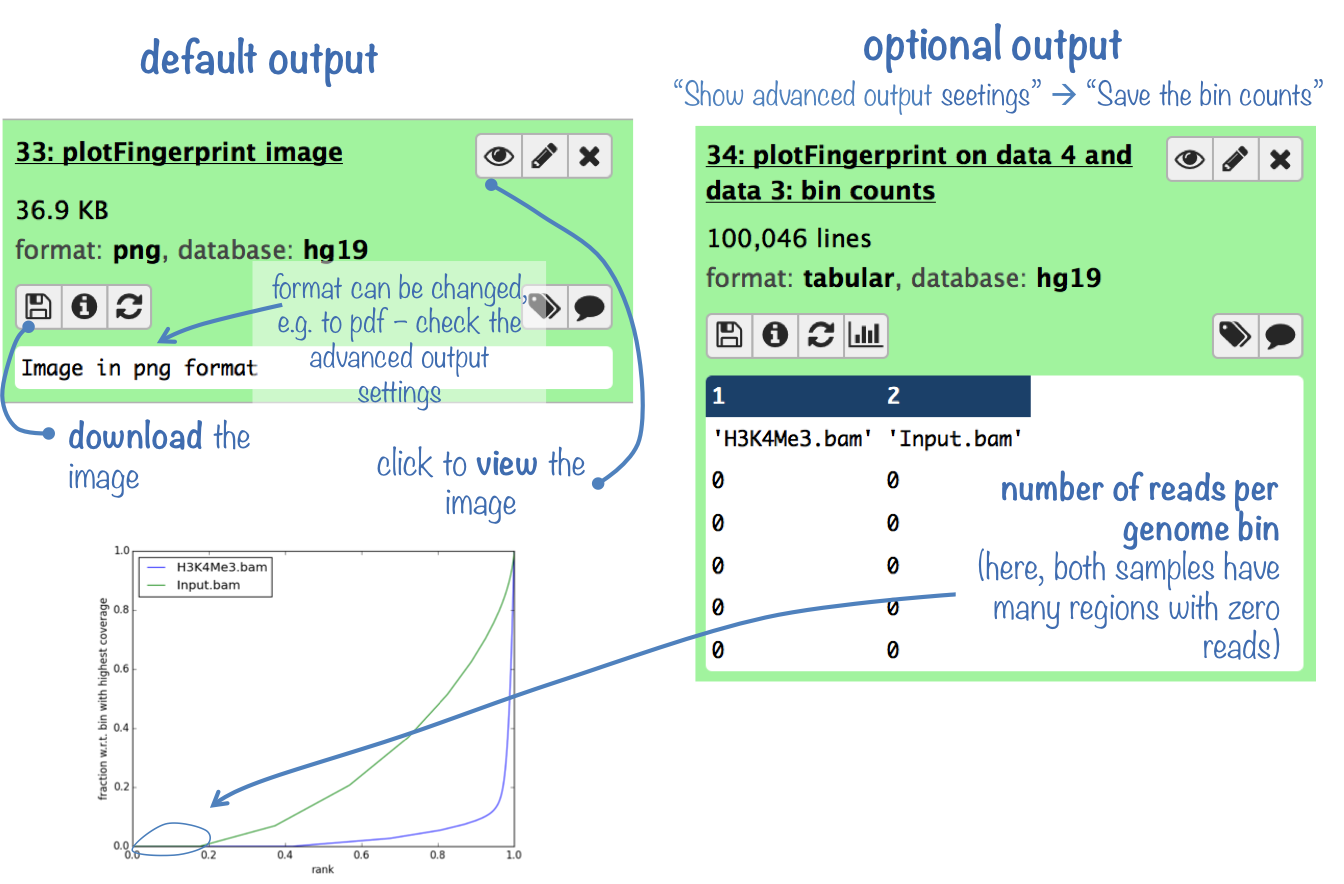
Output
The default output is a diagnostic plot (see below for an example and further down for some background information).
Optionally, you can obtain the table of raw values that were used to generate the plot.
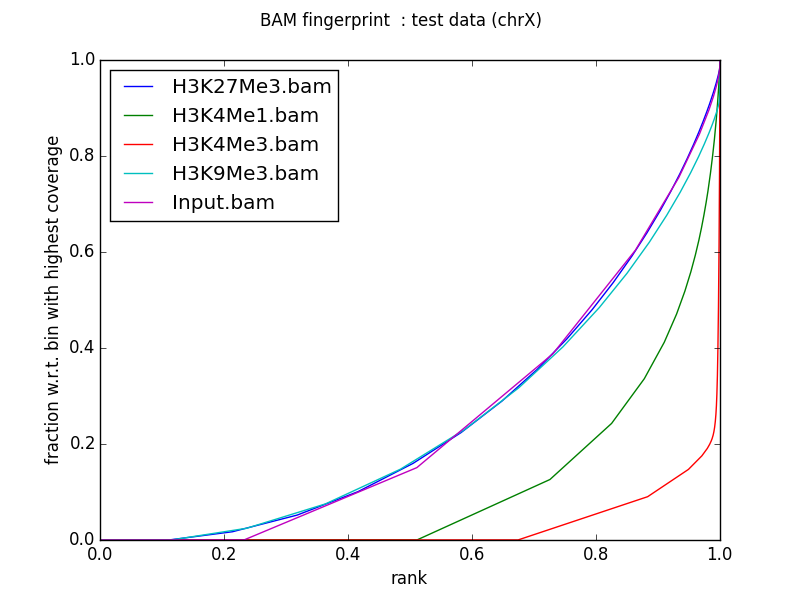
Example plot
What follows is the output of plotFingerprint with our test ChIP-Seq data sets, limiting the analysis to chromosome X. Single-end reads were extended to 200 bp (advanced options).
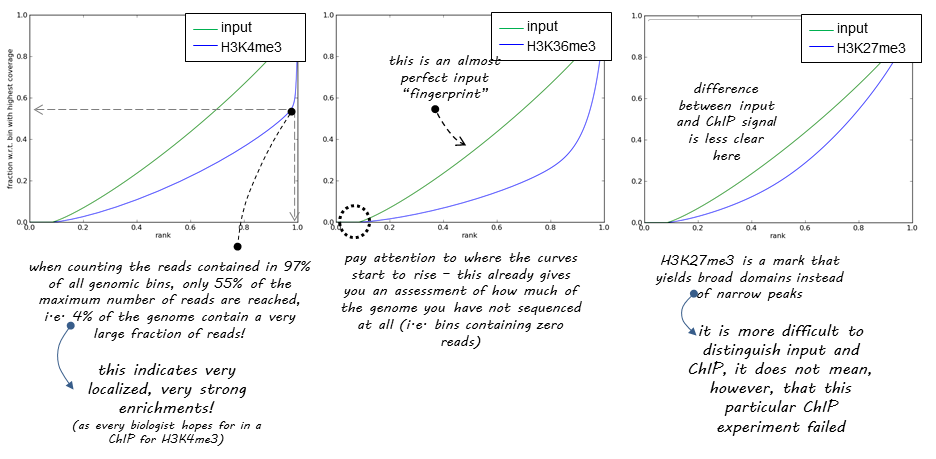
Theoretical Background
The tool first samples indexed BAM files and sums the per-base coverage of reads/fragments overlapping a window (bin) of the specified length. These values are then sorted according to their rank (the bin with the highest number of reads has the highest rank) and the cumulative sum plotted. An ideal input (control) with a uniform distribution of reads alignments and infinite sequencing depth will result in a diagonal line. A very specific and strong ChIP enrichment, on the other hand, would result in a large portion of reads accumulating in just a few bins and the resulting plot showing a steep rise toward the right-most edge. Such results are most commonly seen with transcription factors.
For more information on the tools, please visit our help site.
For support or questions please post to Biostars. For bug reports and feature requests please open an issue on github.
This tool is developed by the Bioinformatics and Deep-Sequencing Unit at the Max Planck Institute for Immunobiology and Epigenetics.