What it does
Creates a boxplot graph for the quality scores in the library.
TIP: Use the FASTQ Statistics tool to generate the report file needed for this tool.
Output Examples
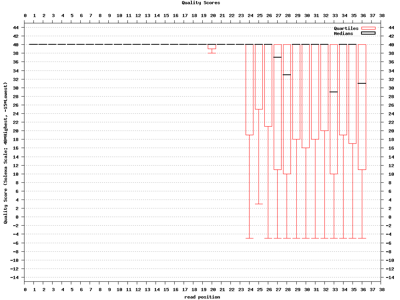
- Black horizontal lines are medians
- Rectangular red boxes show the Inter-quartile Range (IQR) (top value is Q3, bottom value is Q1)
- Whiskers show outlier at max. 1.5*IQR
An excellent quality library (median quality is 40 for almost all 36 cycles):
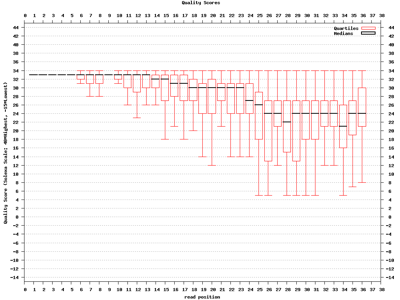
A relatively good quality library (median quality degrades towards later cycles):
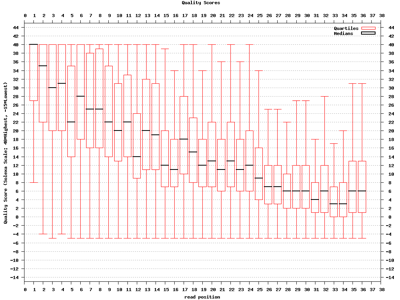
A low quality library (median drops quickly):
This tool is based on FASTX-toolkit by Assaf Gordon.