This tool collapses several populations into one.
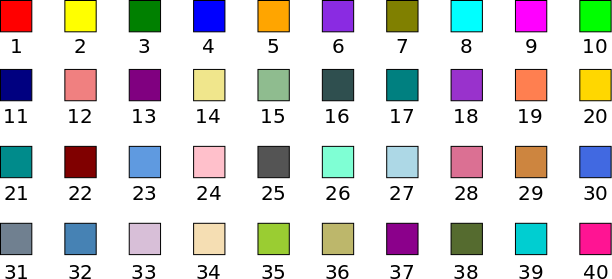
Tip: You can use this tool to assign specific colors to your populations in the FLOCK and Cross Sample overview tools. The color scheme we use is the following:

Input
FLOCK or Cross Sample output - a table of the fluorescence intensities for each event and the population associated with each.
Output
The input file with selected populations replaced by the indicated population.
Example
Input - fluorescence intensities per marker and population ID per event:
Marker1 Marker2 Marker3 ... Population
34      45      12      ... 1
33      65      10      ... 5
19      62      98      ... 2
12      36      58      ... 1
...     ...     ...     ... ...
Populations selected: 2, 5
Collapse into population: 3
Output - fluorescence intensities per marker and population ID per event:
Marker1 Marker2 Marker3 ... Population
34      45      12      ... 1
33      65      10      ... 3
19      62      98      ... 3
12      36      58      ... 1
...     ...     ...     ... ...