Galaxy | Tool Preview

hicPlotMatrix (version 3.7.2+galaxy0)
The label for the heatmap legend.
Instead of plotting the whole matrix each chromosome is plotted next to the other. This parameter is not compatible with --region
Chromosomes to include (and order to plot in):s
Chromosomes to include (and order to plot in): 0
The format is chr:start-end The plotted region contains the main diagonal and is symmetric unless --region2 is given
If given then only the region defined by --region and --region2 is plotted. The format is the same as --region
Fontsize in the plot for x and y axis.
Rotation in degrees for the labels of x-axis.
Rotation in degrees for the labels of y-axis.
Plotting additional bigwig tracks can cause compression in x or y direction of the heatmap. Set this factor to a value unequal to 0 to correct this.
Available color map names can be found here: https://matplotlib.org/examples/color/colormaps_reference.html
Minimum value of the plotted score.
Maximum value of the plotted score.
Change the default resolution of the plot.

Contact matrix plot

hicPlotMatrix is a visualization tool for Hi-C contact matrices. It supports to plot genome-wide contact matrices, one or multiple chromosomes, a region or two regions against each other. Additionally it can plot the result of a principal component analysis obtained by hicPCA to have a better understanding of A / B compartments.


Usage

This tool can be used on any h5 or cool Hi-C contact matrix. It is noteworthy that for comparisons of 2 matrices or more, they must all have the same or similar number of contacts.


Output

hicPlotMatrix outputs a heatmap of a contact matrix in either png or svg format, below is an example of such a plot:

/repository/static/images/6385707b170e5a13/hicPlotMatrix.png

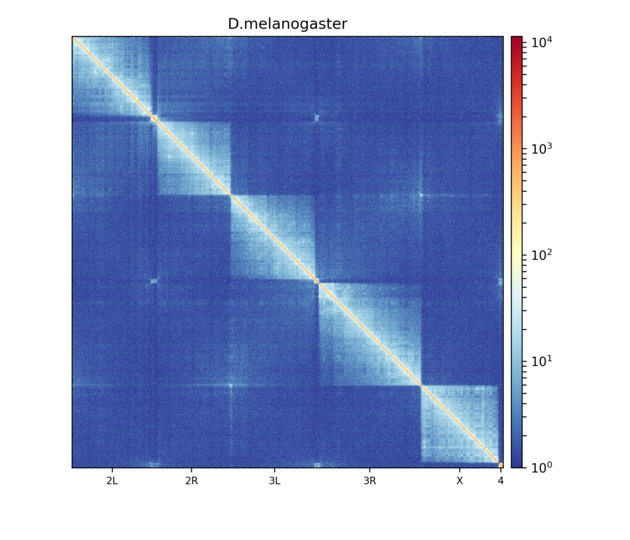
Contact matrix of Drosophila melanogaster embryos visualized using hicPlotMatrix. Hi-C matrix bins were merged to a 25 kb bin size using hicMergeMatrixBins and the matrix has then been corrected using hicCorrectMatrix before plotting.

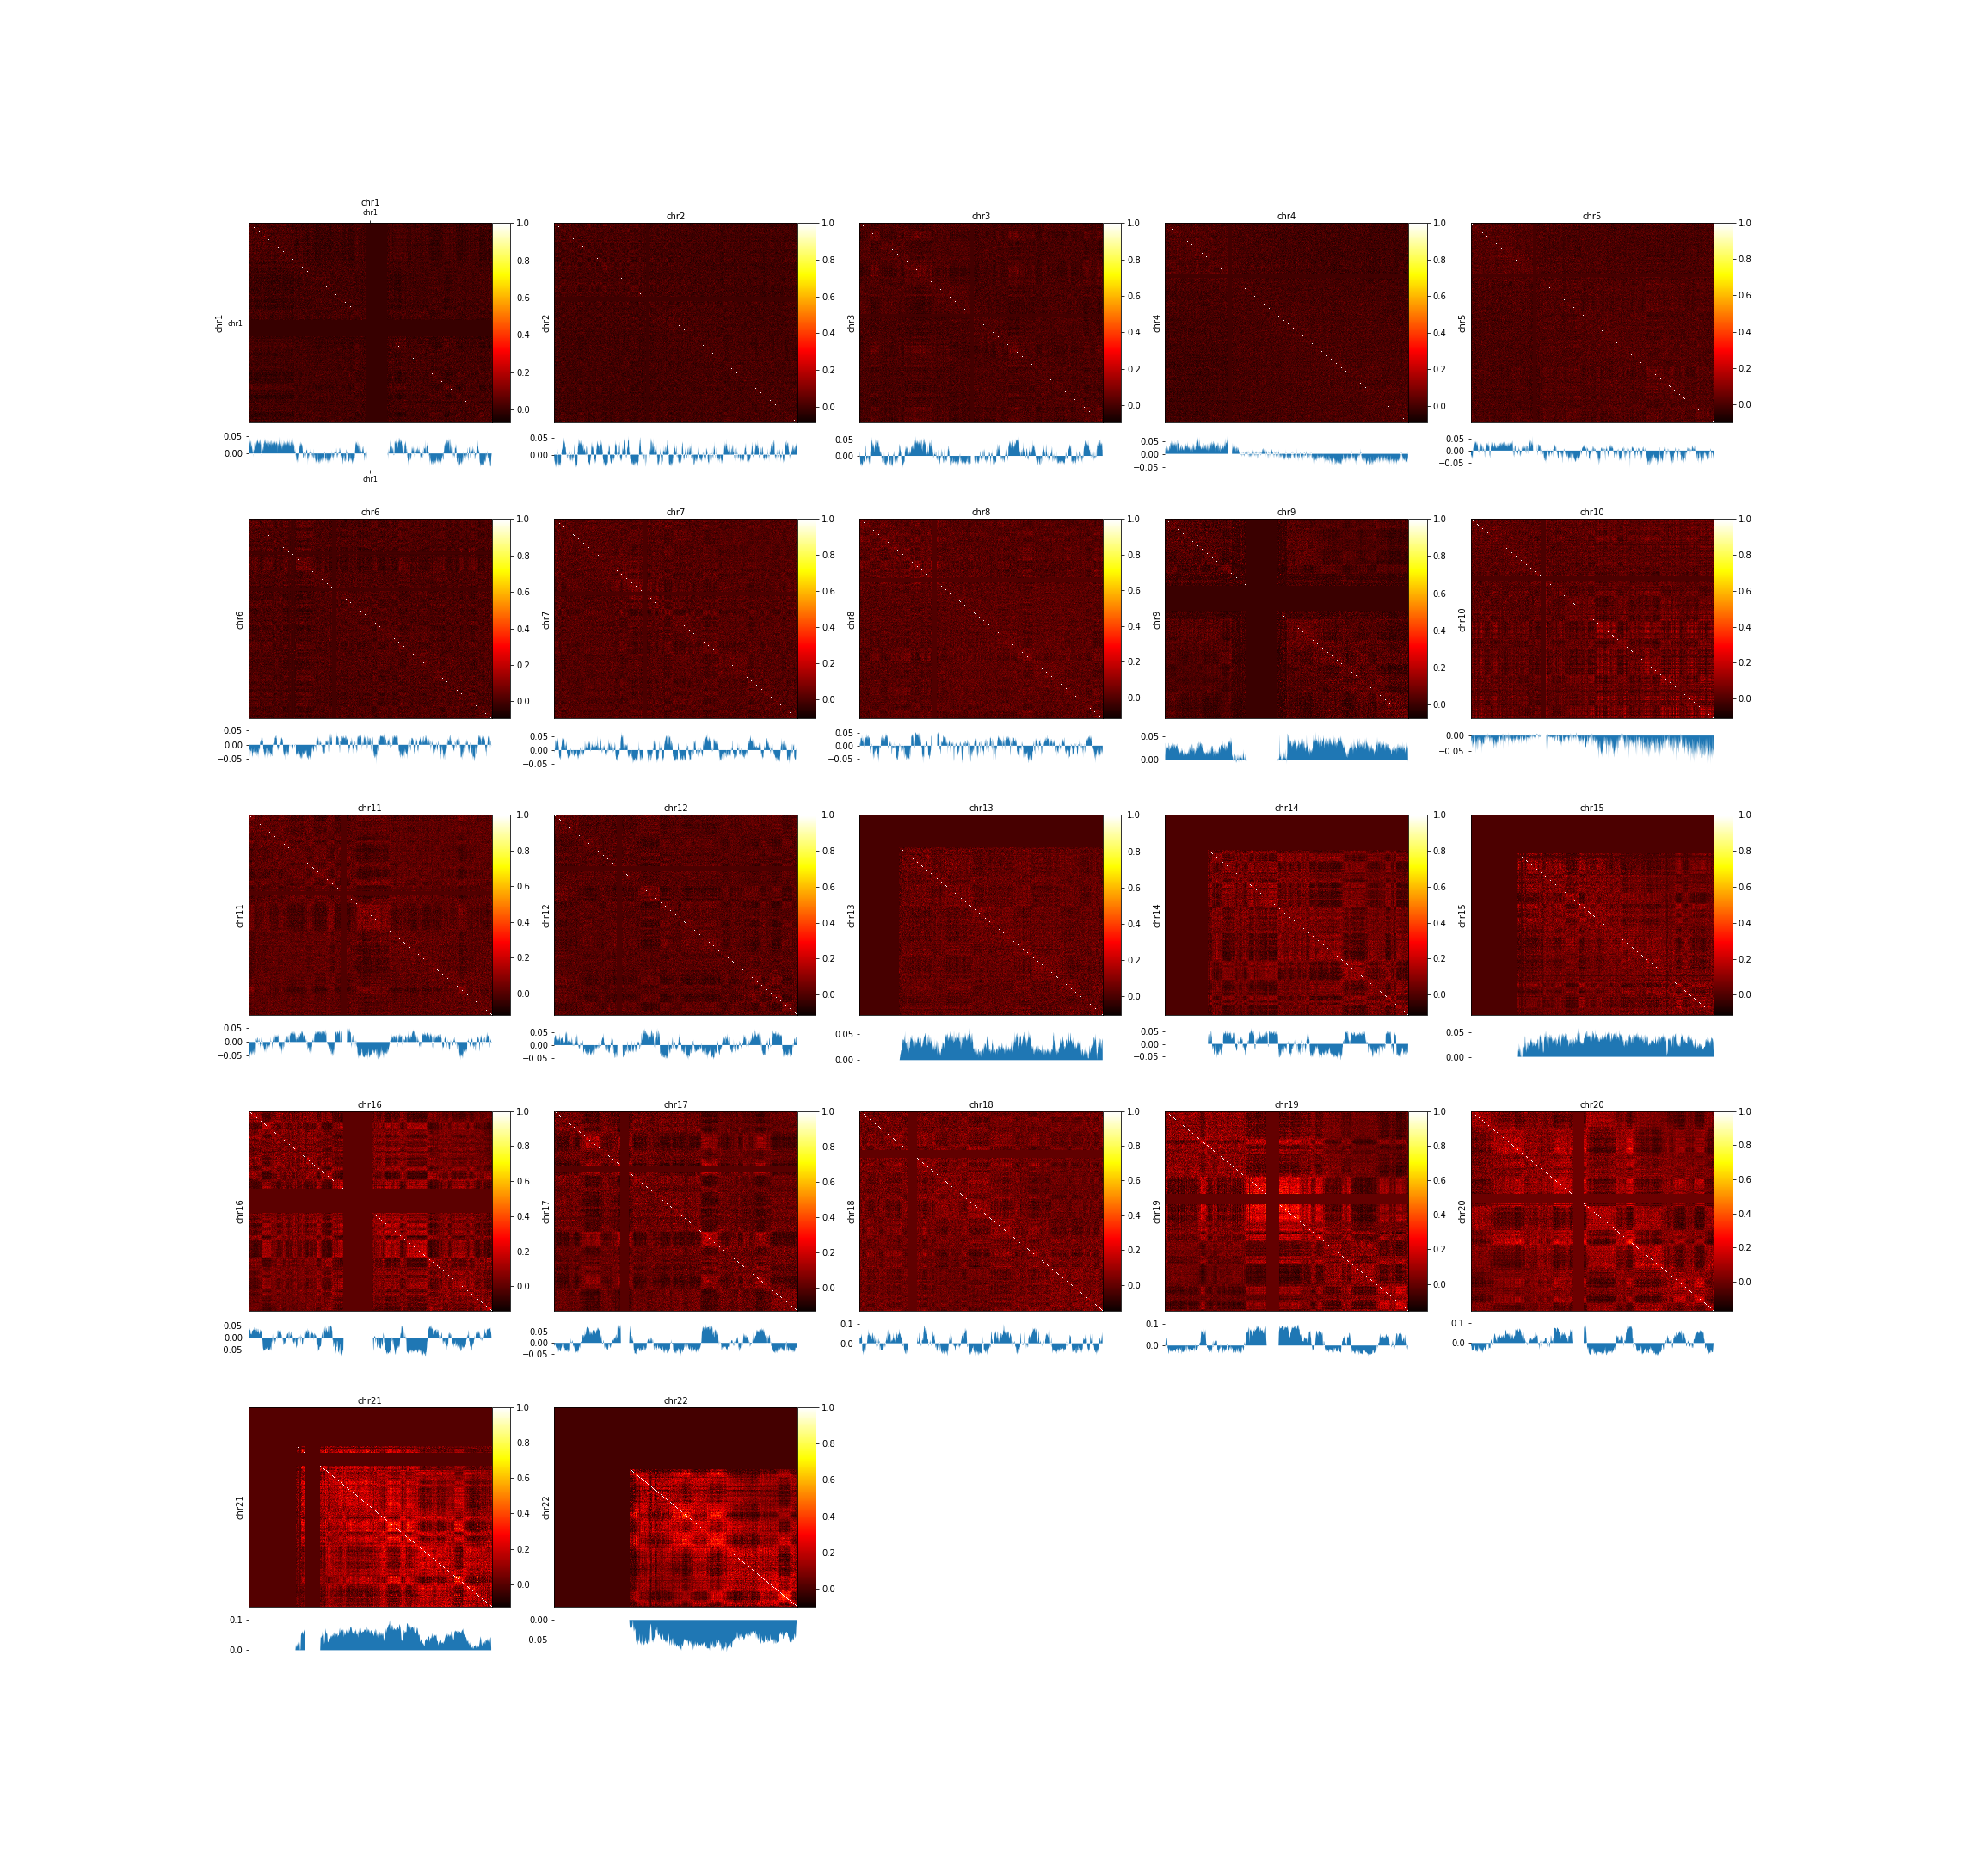
Another example is available below using Hi-C data published by Lieberman-Aiden in 2009, (GSE18199). A Hi-C contact matrix has been plotted with the --perChr option and the first eigenvector (pca1) computed by hicPCA. For this plot a pearson correlated matrix was used, which is computed by first creating an observed / expected matrix and then a pearson correlation matrix with hicTransform.

/repository/static/images/6385707b170e5a13/SRR0279XX_perChr_eigenvector1.png
For more information about HiCExplorer please consider our documentation on readthedocs.io