Loop detection
Computes enriched regions (peaks) or long range contacts on the given contact matrix.
hicDetectLoops can detect enriched interaction regions (peaks / loops) based on a strict candidate selection, negative binomial distributions and Wilcoxon rank-sum tests.
The algorithm was mainly develop on GM12878 cells from Rao 2014 on 10kb and 5kb fixed bin size resolution.
Usage
A command line example is available below (easily matchable in Galaxy using each field information):
̀`$ hicDetectLoops -m matrix.cool -o loops.bedgraph --maxLoopDistance 2000000 --windowSize 10 --peakWidth 6 --pValuePreselection 0.05 --pValue 0.05 --peakInteractionsThreshold 20`
The candidate selection is based on the restriction of the maximum genomic distance, here 2MB. This distance is given by Rao 2014. For each genomic distance a negative binomial distribution is computed and only interaction pairs with a threshold less than --pValuePreselection are accepted. Detected candidates need to have at least an interaction count of --maximumInteractionPercentageThreshold times the maximum value for their genomic distance. Please note that --maximumInteractionPercentageThreshold was introduced with HiCExplorer release 3.2. Earlier versions did not have this parameter yet and therefore their outputs may differ. In a second step, each candidate is considered compared to its neighborhood. This neighborhood is defined by the --windowSize parameter in the x and y dimension. Per neighborhood only one candidate is considered, therefore only the candidate with the highest peak values is accepted. As a last step, the neighborhood is split into a peak and background region (parameter --peakWidth). The peakWidth can never be larger than the windowSize. However, we recommend for 10kb matrices a windowSize of 10 and a peakWidth of 6.
The output file (´´-o loops.bedgraph``) contains the x and y position of each loop and its corresponding p-value of the Anderson-Darling test.
1 120000000 122500000 1 145000000 147500000 0.001
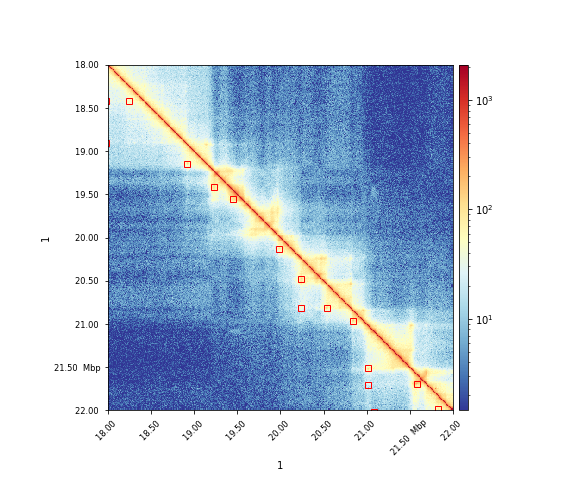
The results can visualized via hicPlotMatrix:
$ hicPlotMatrix -m matrix.cool -o plot.png --log1p --region 1:18000000-22000000 --loops loops.bedgraph
For more information about HiCExplorer please consider our documentation on readthedocs.io.