What it does
HUMAnN is a pipeline for efficiently and accuretly profiling the presence/absence and abundance of microbial pathways in a community from metagenomic or metatranscriptomic sequencing data.
Read more about the tool: http://huttenhower.sph.harvard.edu/humann2/manual.
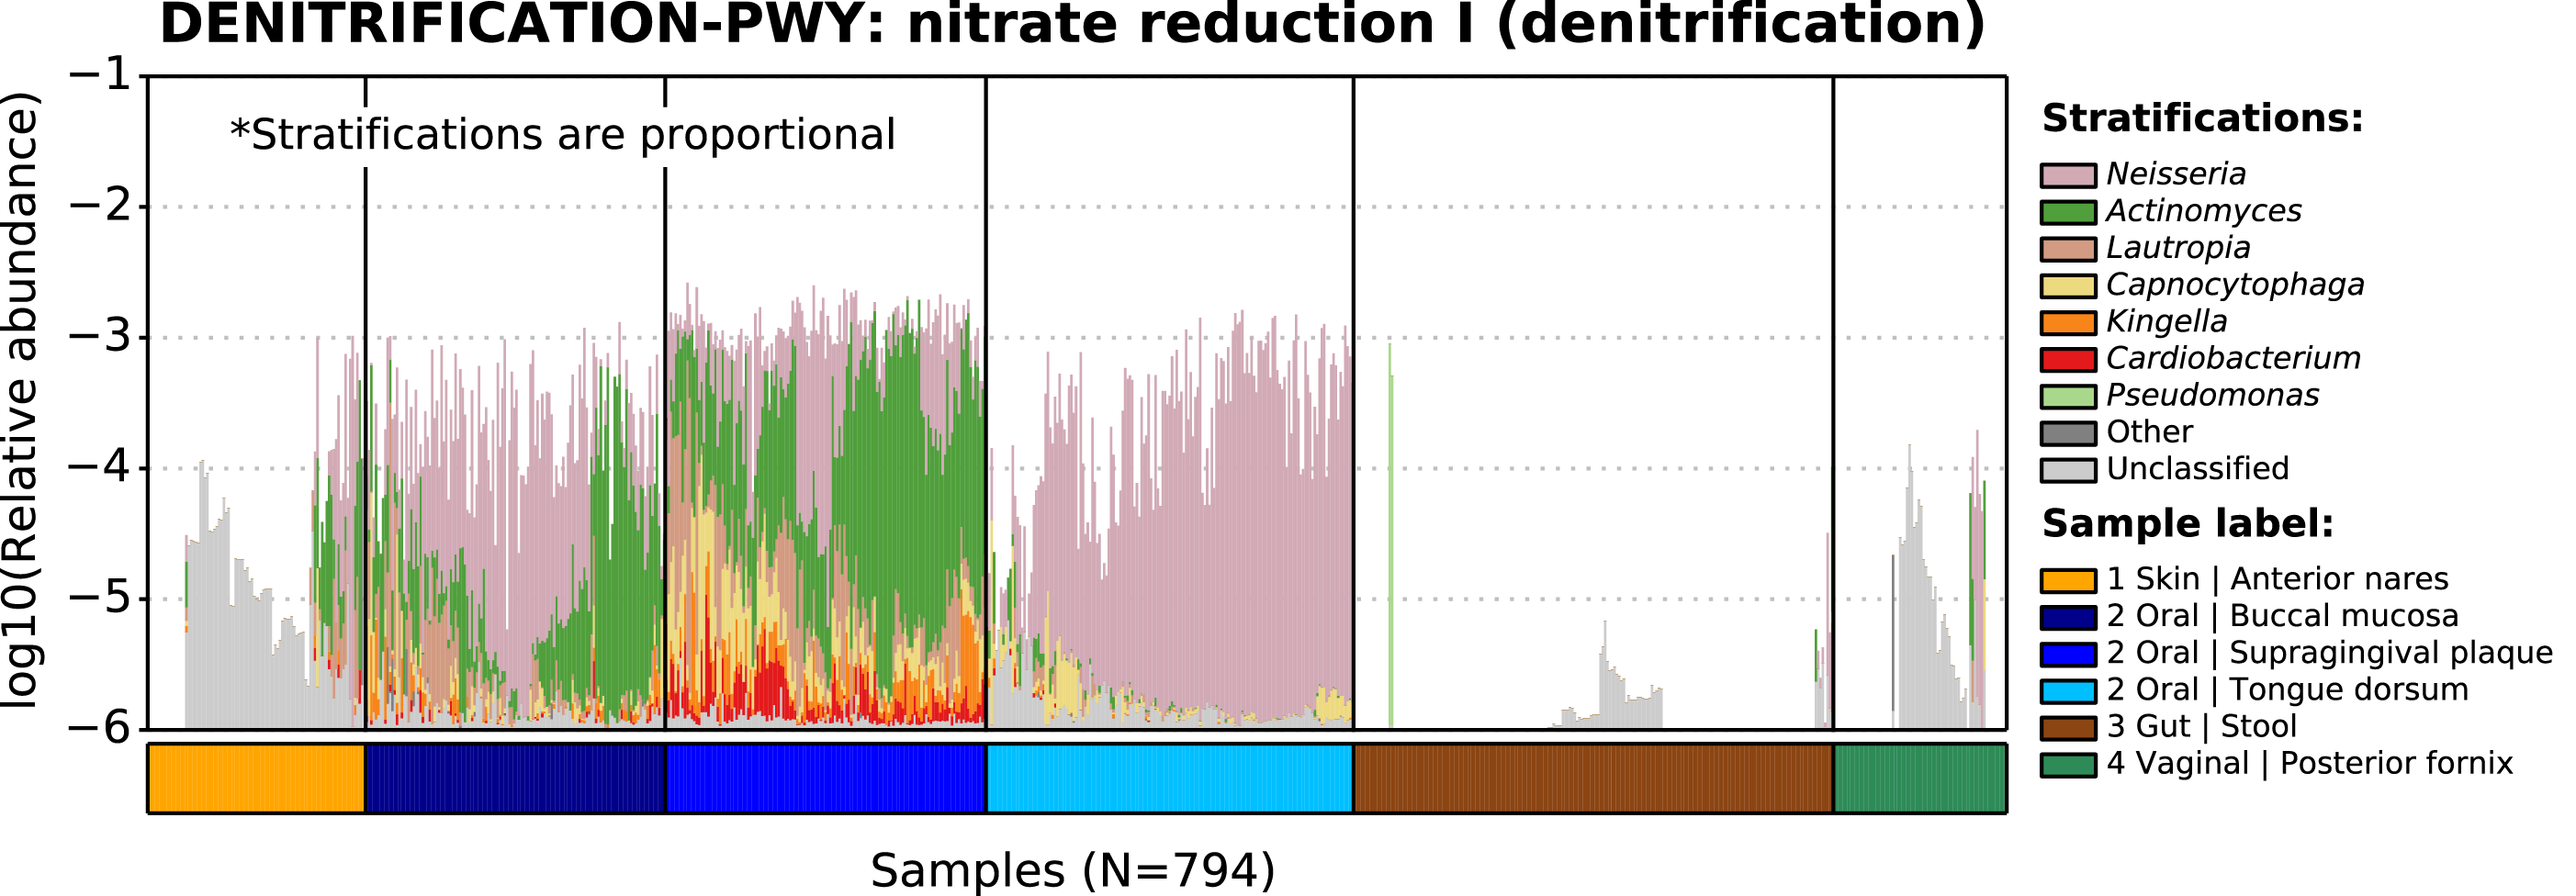
humann2_barplot produces plots of stratified HUMAnN2 features and includes many options for sorting and scaling data
Here is an example of a HUMAnN2 barplot for a pathway (denitrification) that was preferentially enriched in Human Microbiome Project oral samples relative to other body sites. This figure uses many options from humann2_barplot, including regrouping by genus, pseudolog scaling, and sorting samples by similarity and metadata: