What it does
This tool is useful to assess the sequencing depth of a given sample. It samples 1 million bp, counts the number of overlapping reads and reports a coverage histogram that tells you how many bases are covered how many times.
Note: Multiple BAM files are accepted but all should correspond to the same genome assembly.
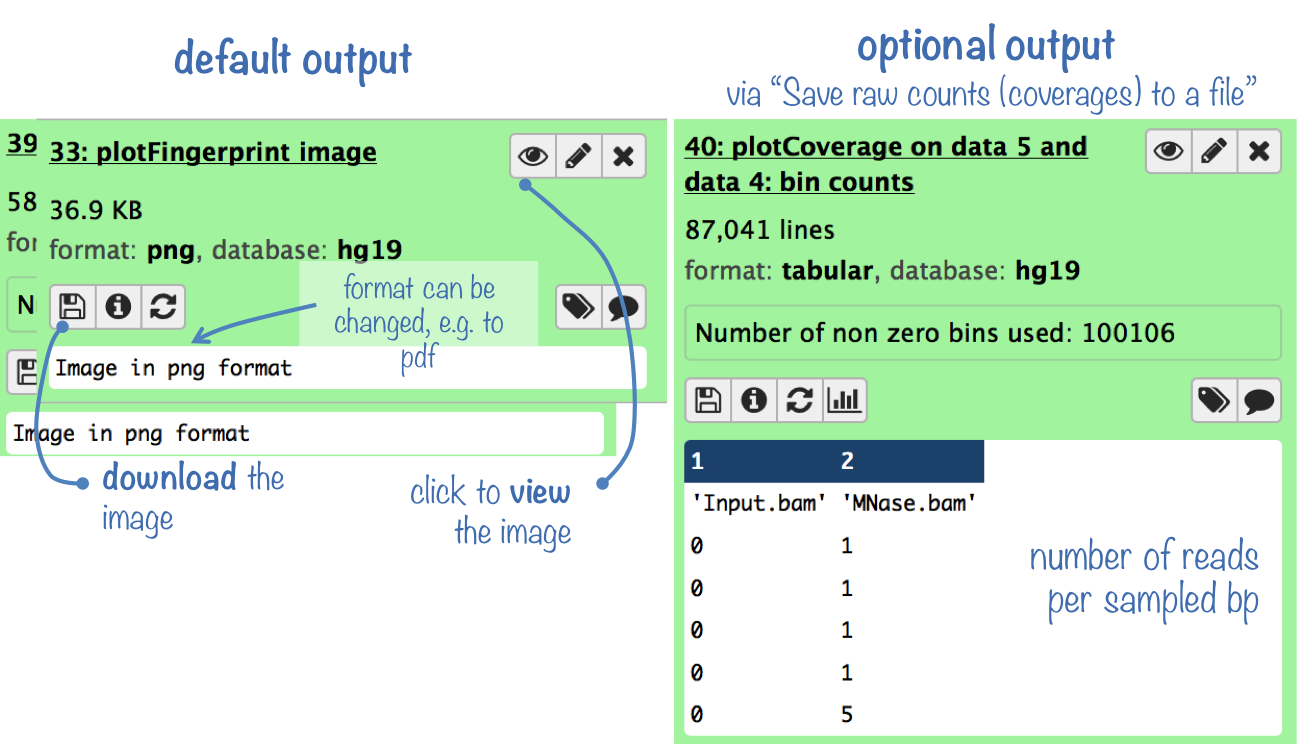
Output
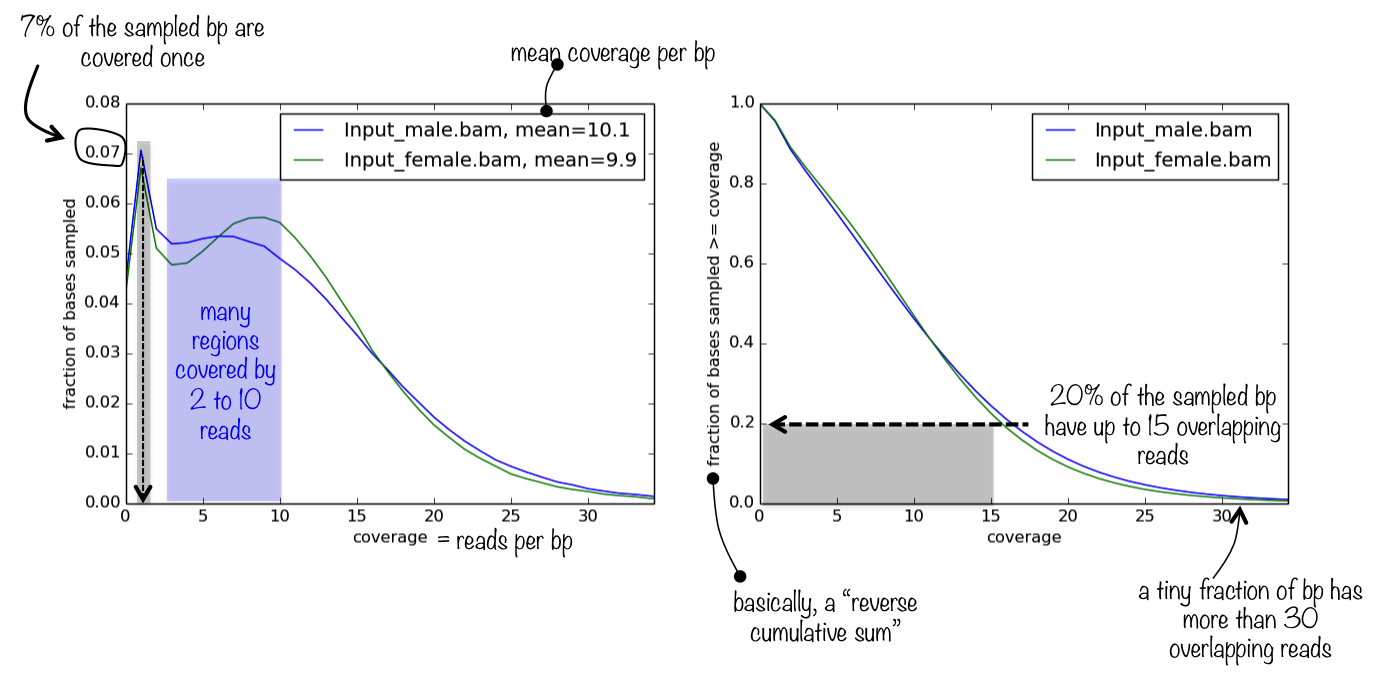
The default output is a panel of two plots (see below for an example): One is a density plot visualizing the frequencies of read coverages, the other one lets you estimate what fraction of the genome has a depth of sequencing of, for example, 2 overlapping reads or more.
The optional output is a table where each row represents the number of reads overlapping with a sampled bp.
Example plot
For more information on the tools, please visit our help site.
For support or questions please post to Biostars. For bug reports and feature requests please open an issue on github.
This tool is developed by the Bioinformatics and Deep-Sequencing Unit at the Max Planck Institute for Immunobiology and Epigenetics.