Galaxy | Tool Preview

scHicPlotConsensusMatrices (version 4.1)
Please separate the chromosomes by space
Available color map names can be found here: https://matplotlib.org/examples/color/colormaps_reference.html
Change the default resolution of the plot.

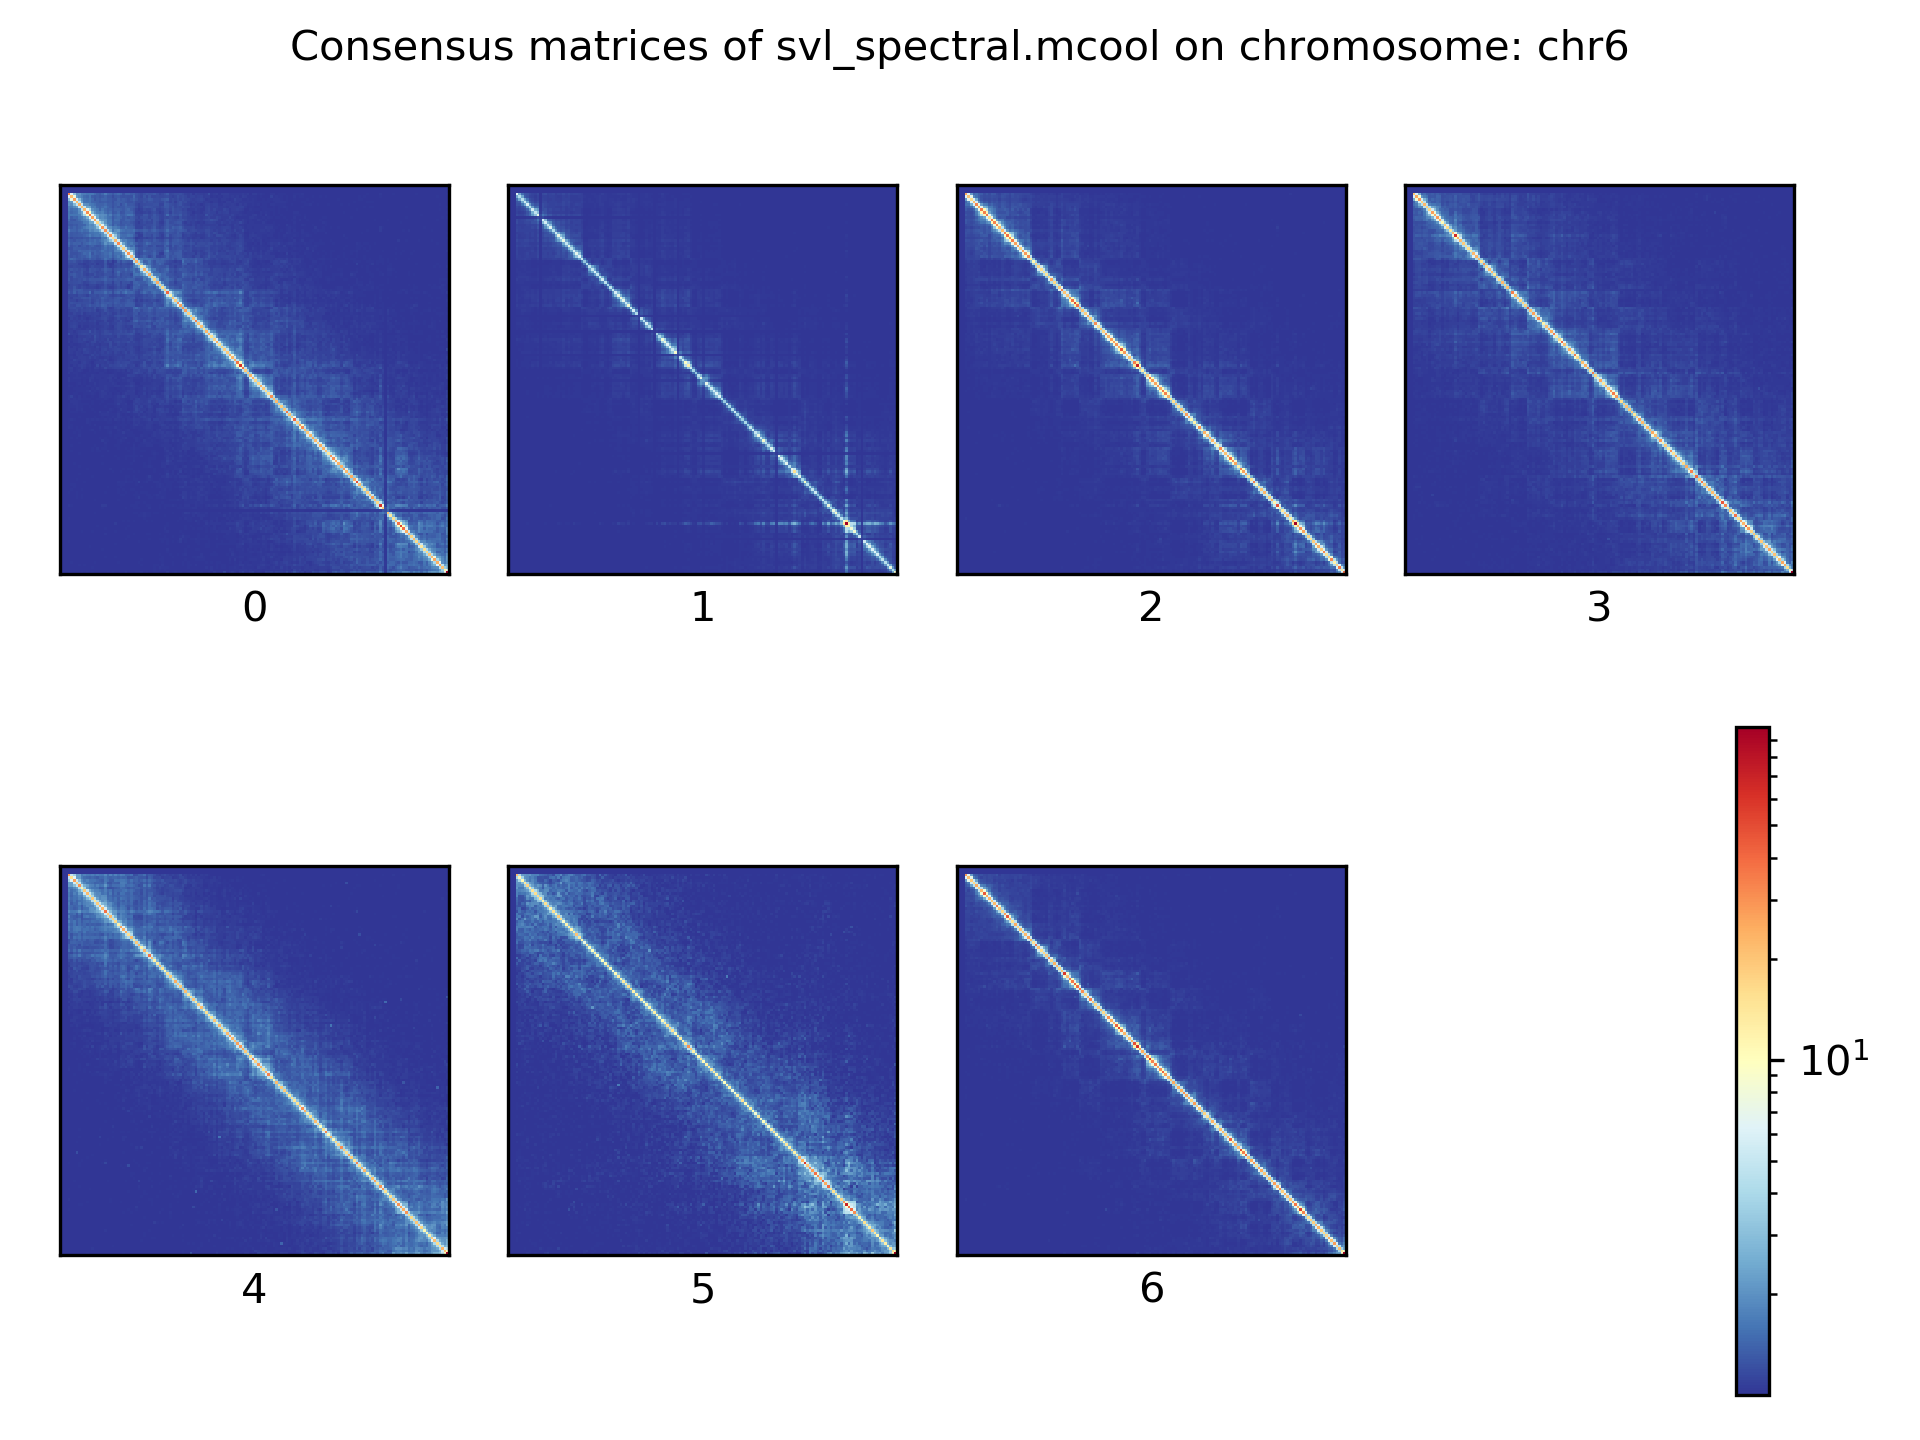
Plot consensus matrices

scHicPlotConsensusMatrices plots the consensus (average) matrix of a cluster. This tool is useful to compare the single cell clusters.

/repository/static/images/2352595c0b5ac3fb/consensus_svl_spectral.png

For more information about scHiCExplorer please consider our documentation on readthedocs.io