What it does
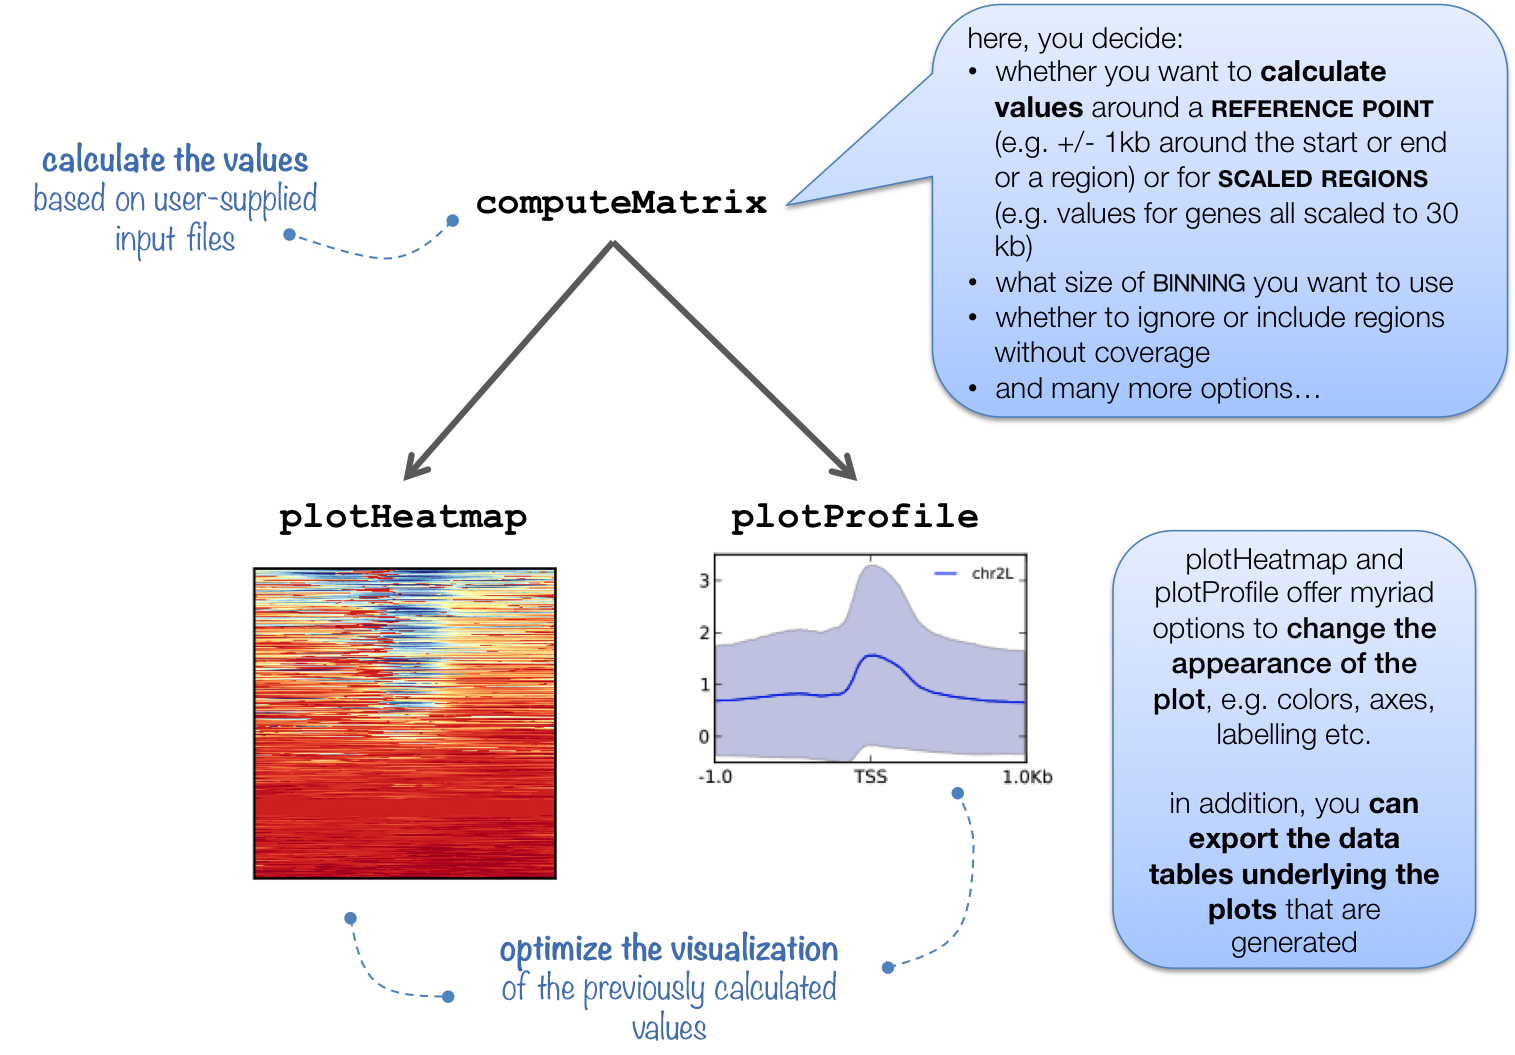
This tool prepares an intermediate file (a gzipped table of values) that contains scores associated with genomic regions. The regions can either be scaled to the same size (using the scale-regions mode) or you can choose the start, end, or center of each region as the focus point for the score calculations. For more details, check out the explanation here.
The intermediate file produced by computeMatrix is meant to be used with plotHeatmap and plotProfile. See the descriptions of plotHeatmap and plotProfile for example plots.
Usage hints
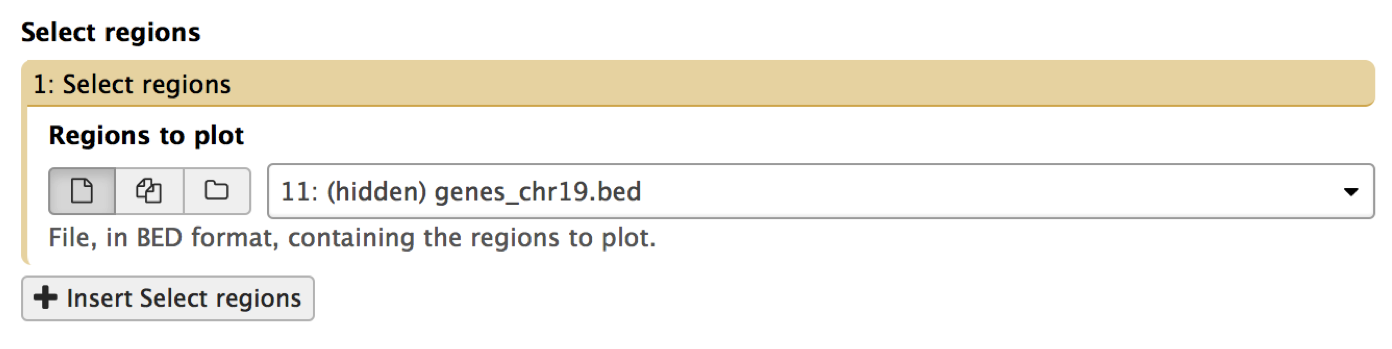
The supplied genomic regions can really be anything - genes, parts of genes, ChIP-seq peaks, favorite genome regions... as long as you provide a proper file in BED or INTERVAL format. If you would like to compare different groups of regions (e.g., genes from chromosome 2 and 3), you can supply more than 1 regions file, one for each group by selecting "Insert Select regions".
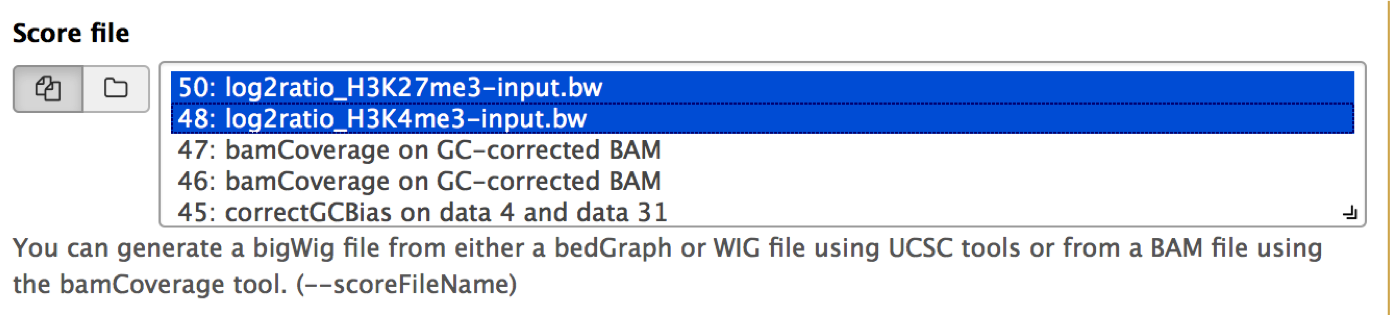
You can select as many score (bigWig) files as you like. Simply use the Shift and/or Command key while clicking on the files of interest.
The multitude of parameters can seem daunting at first - here are the options that we tend to tune most often:
- bin Size -- The default value works well most of the time, but if you want to have a more finely grained image, decrease the default value (but not smaller than your bigWig file(s)' bin size). If you want to reduce the computation time, increase it.
- Skip zeros -- useful to avoid completely blank lines in the heatmap.
- Convert missing values to 0? -- If you want to identify clusters of similar regions in an unsupervised fashion using plotHeatmap and/or plotProfile, you should definitely set this to 'yes'.
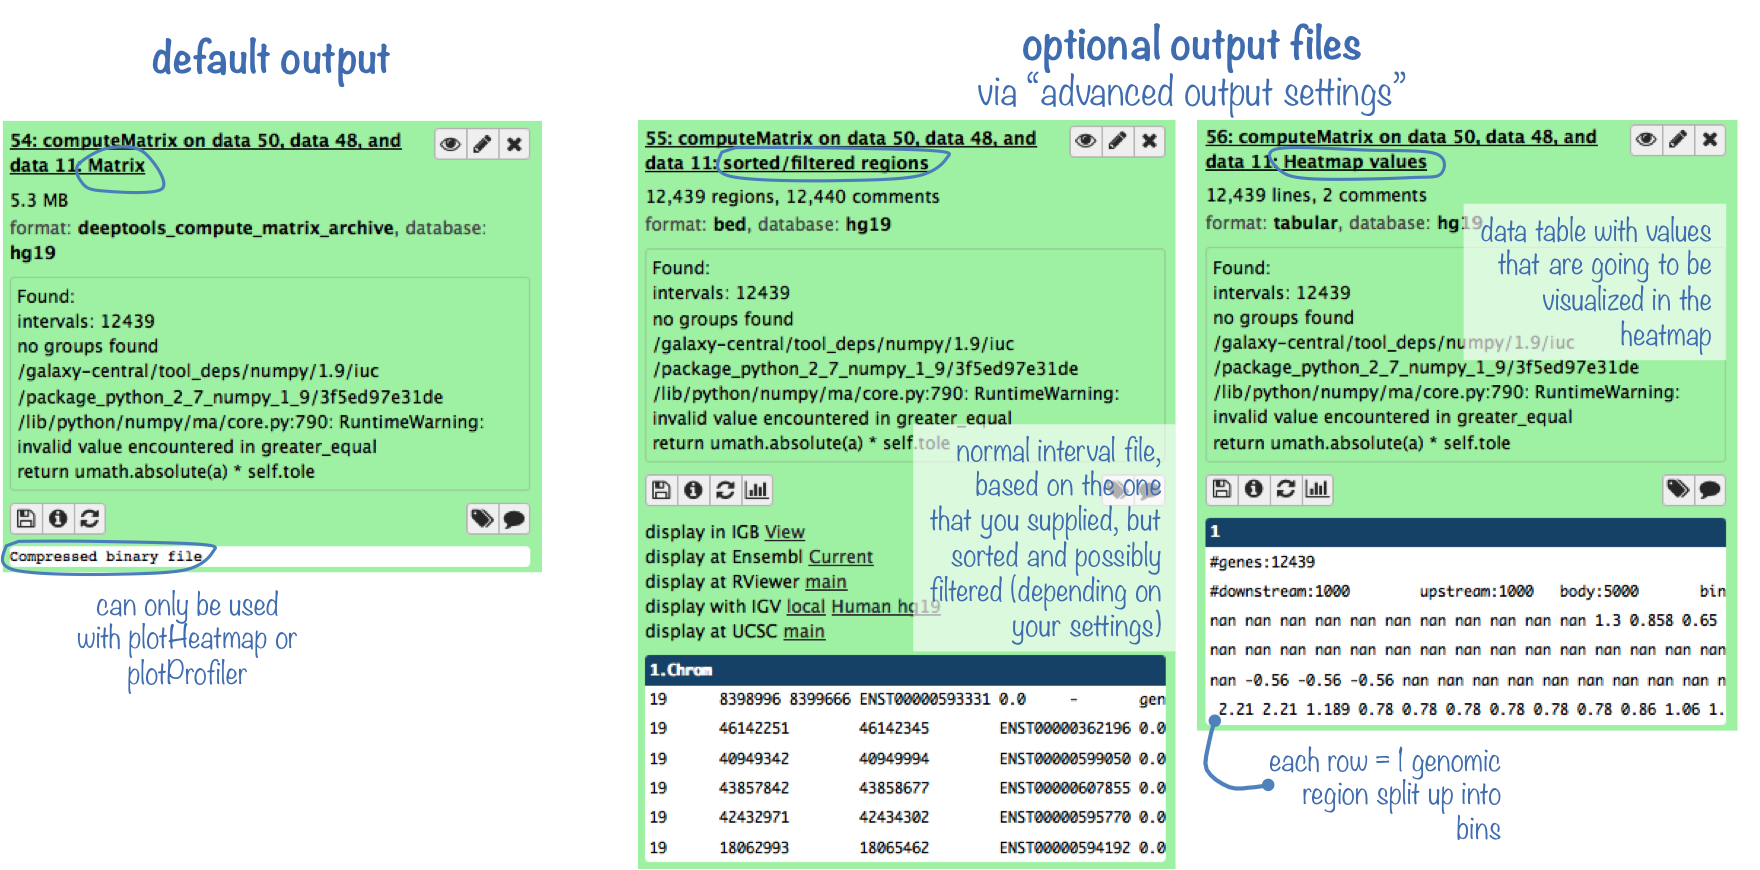
Output files
The default output is a gzipped table of values that is used by both plotHeatmap and plotProfile.
The optional output files include a) the regions after sorting and filtering (if selected) as they were used to calculate the values for the plotting, and b) the uncompressed table that underlies the heatmap.
TIP: computeMatrix can also be used to filter and sort regions according to their score by making use of the "advanced output settings".
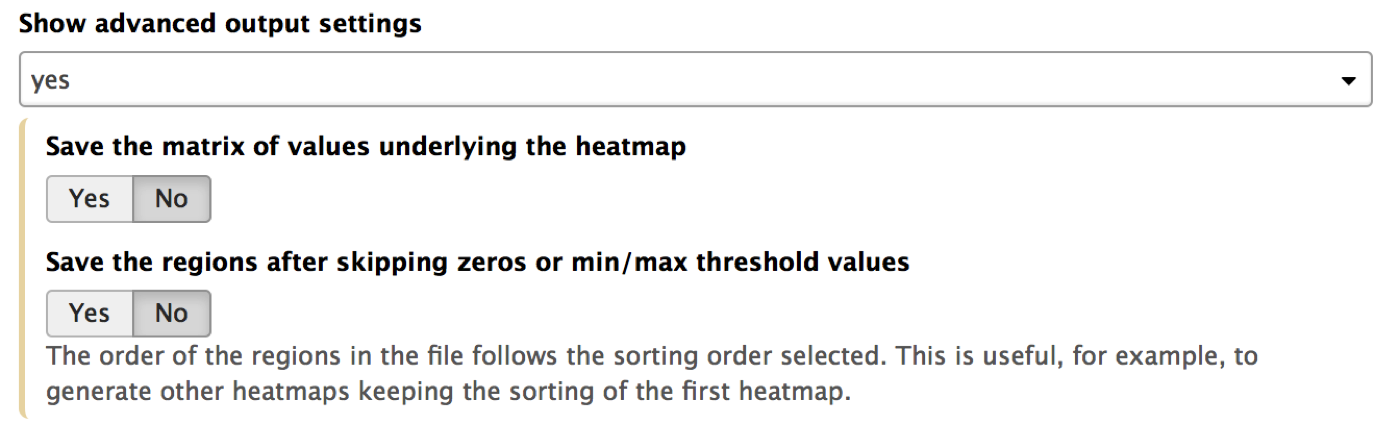
Note that these advanced output options are available for plotHeatmap and plotProfile, too.
See the following table for the optional output options:
| optional output type | computeMatrix | plotHeatmap | plotProfile |
| values underlying the heatmap | yes | yes | no |
| values underlying the profile | no | no | yes |
| sorted and/or filtered regions | yes | yes | yes |
More examples can be found in our Gallery.
For more information on the tools, please visit our help site.
For support or questions please post to Biostars. For bug reports and feature requests please open an issue on github.
This tool is developed by the Bioinformatics and Deep-Sequencing Unit at the Max Planck Institute for Immunobiology and Epigenetics.