What it does
This tool computes the average scores for every genomic region for every bigWig file that is provided. In principle, it does the same as multiBamSummary, but for bigWig files.
The analysis is performed for the entire genome by running the program in 'bins' mode, or for certain user selected regions (e.g., genes) in 'BED-file' mode.
Typically the output of multiBigwigSummary is used by other tools, such as plotCorrelation or plotPCA, for visualization and diagnostic purposes.
Output
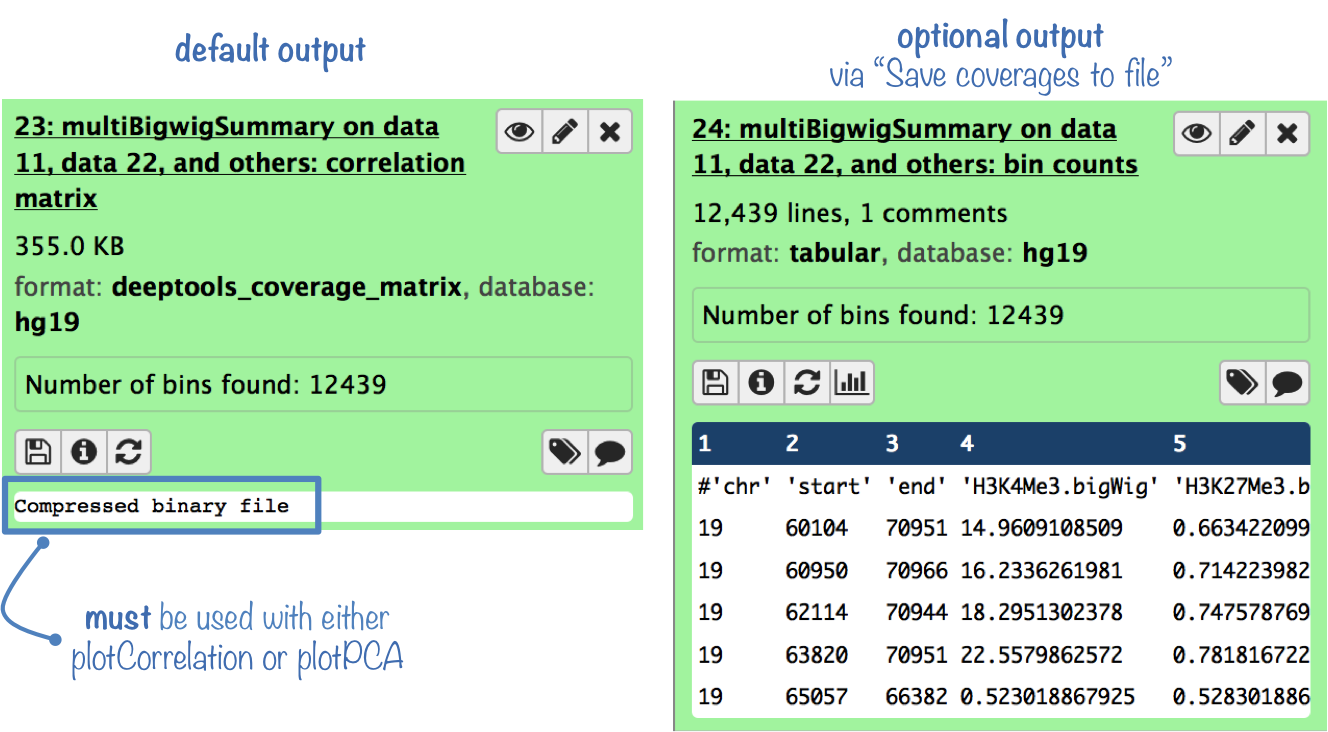
The default output is a compressed file that can only be used with plotPCA or plotCorrelation.
To analyze the average scores yourself, you can get the uncompressed score matrix where every row corresponds to a genomic region (or bin) and each column corresponds to a sample (BAM file). (To obtain this output file, select "Save raw counts (coverages) to file" )

For more information on the tools, please visit our help site.
For support or questions please post to Biostars. For bug reports and feature requests please open an issue on github.
This tool is developed by the Bioinformatics and Deep-Sequencing Unit at the Max Planck Institute for Immunobiology and Epigenetics.