This tool allows you to plot values contained in columns of a dataset against each other and also allows you to have different series corresponding to the same or different datasets in one plot.
This tool throws an error if the columns selected for plotting are absent or are not numeric and also if the lengths of these columns differ.
Example
Input file:
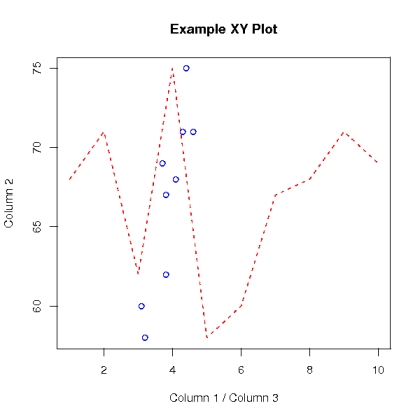
1   68  4.1
2   71  4.6
3   62  3.8
4   75  4.4
5   58  3.2
6   60  3.1
7   67  3.8
8   68  4.1
9   71  4.3
10  69  3.7
Create a two series XY plot on the above data:
- Series 1: Red Dashed-Line plot between columns 1 and 2
- Series 2: Blue Circular-Point plot between columns 3 and 2