What it does
This tool determines read/fragment coverage of regions. The regions (e.g., exons, genes or peaks) can be specified in one or more BED or GTF files. For GTF files, the feature type is taken from column 3. For BED files, the file name is used. For BED files, the feature labels can be changed.
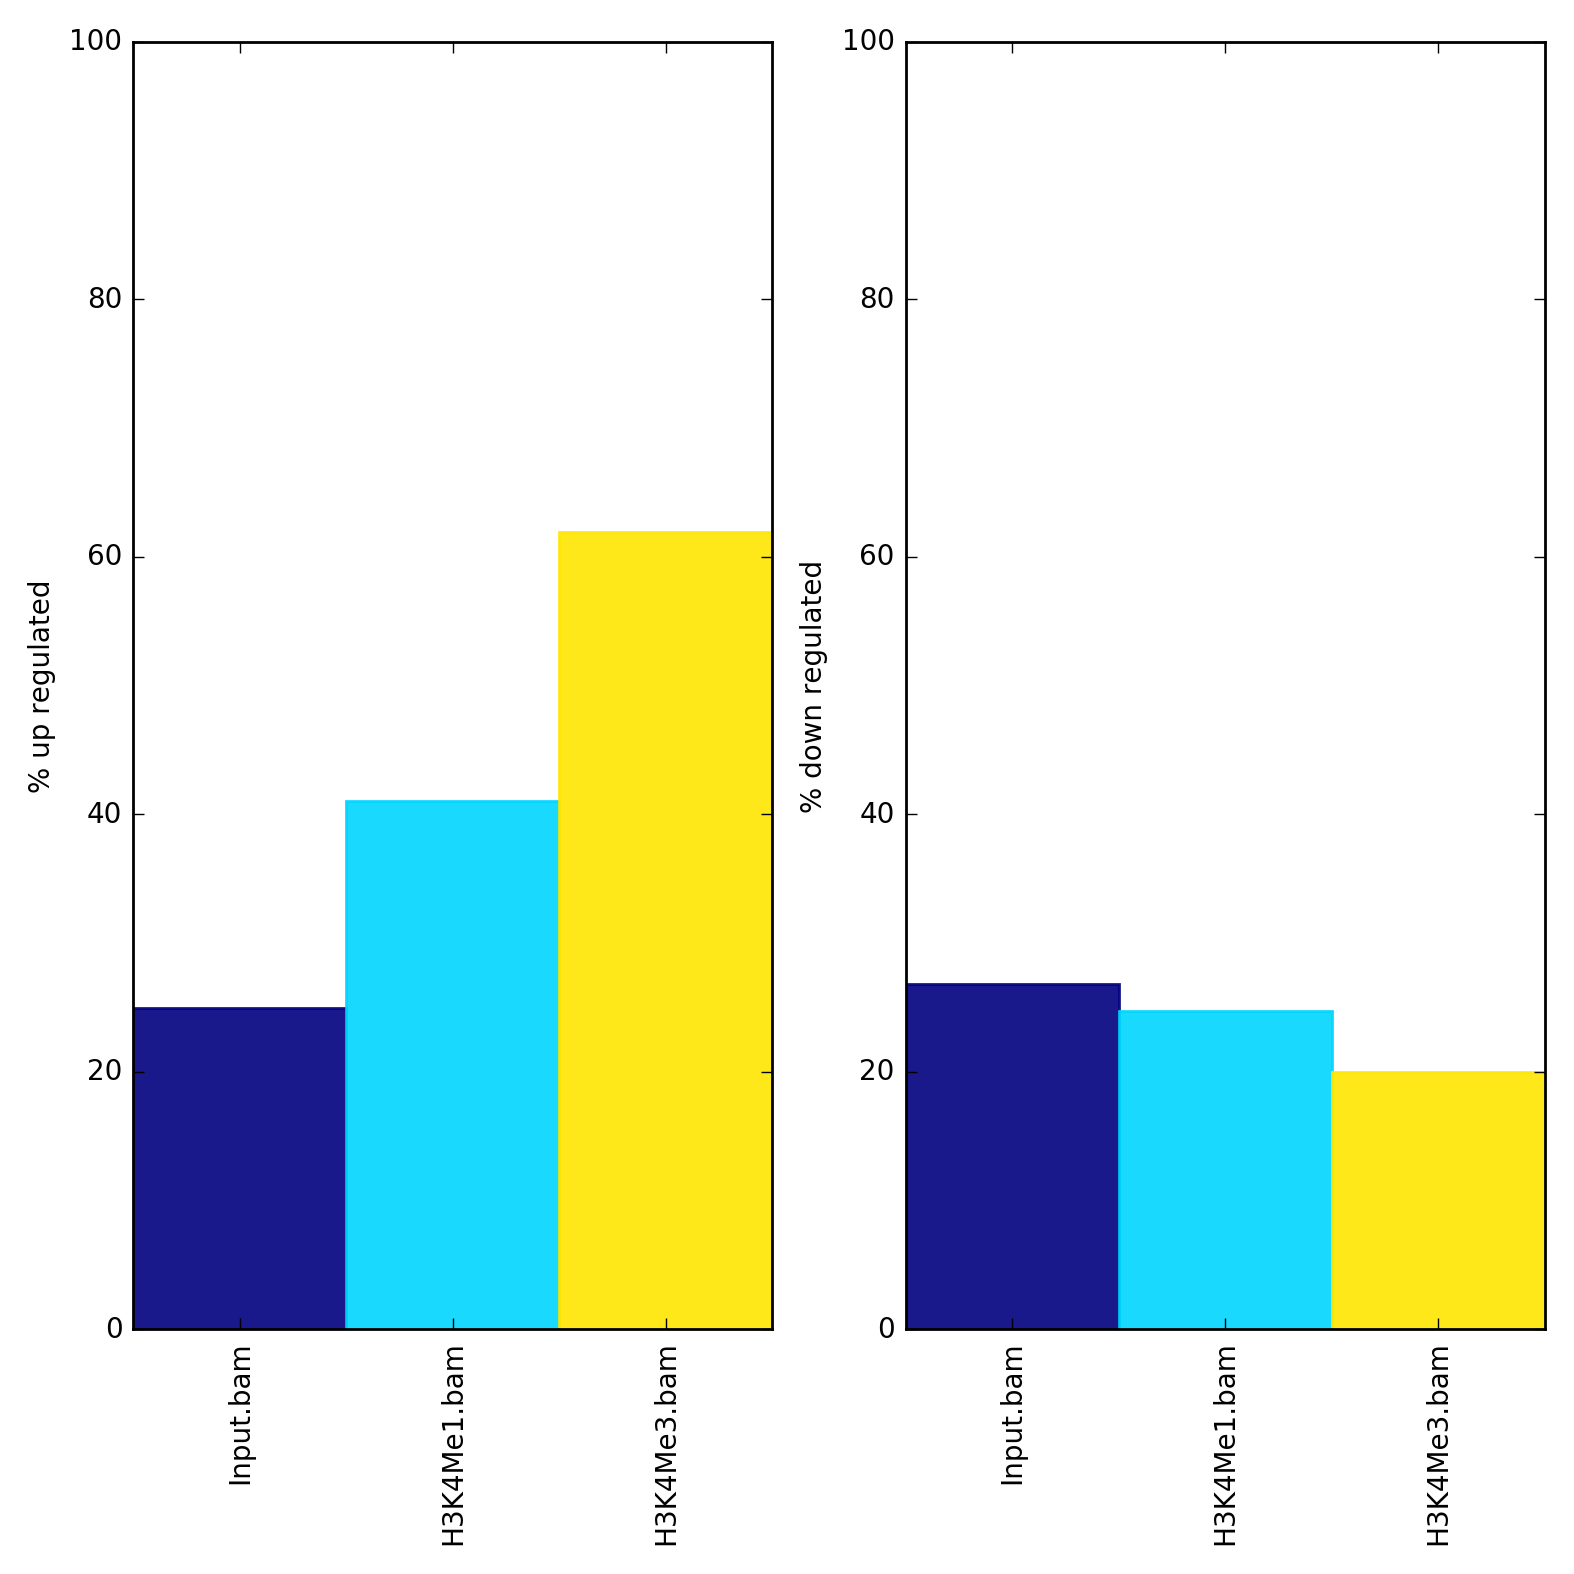
Output
The output file is a plot in the format specified. A table of the percentages and raw counts can also be created.
For more information on the tools, please visit our help site.
For support or questions please post to Biostars. For bug reports and feature requests please open an issue on github.
This tool is developed by the Bioinformatics and Deep-Sequencing Unit at the Max Planck Institute for Immunobiology and Epigenetics.