Dataset formats
The input format is interval, and the output is an image in PDF format. (Dataset missing?)
What it does
HilbertVis uses the Hilbert space-filling curve to visualize the structure of position-dependent data. It maps the traditional one-dimensional line visualization onto a two-dimensional square. For example, here is a diagram showing the path of a level-2 Hilbert curve.

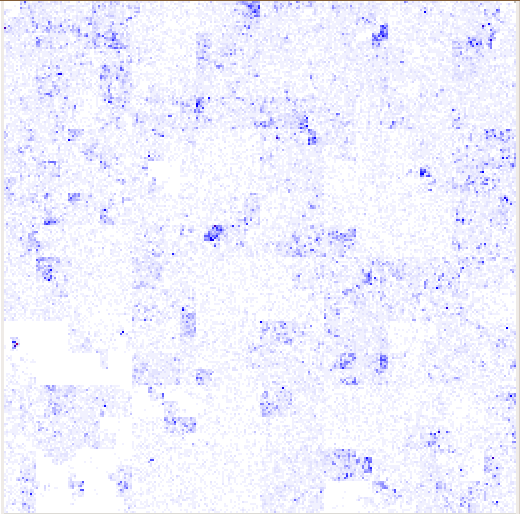
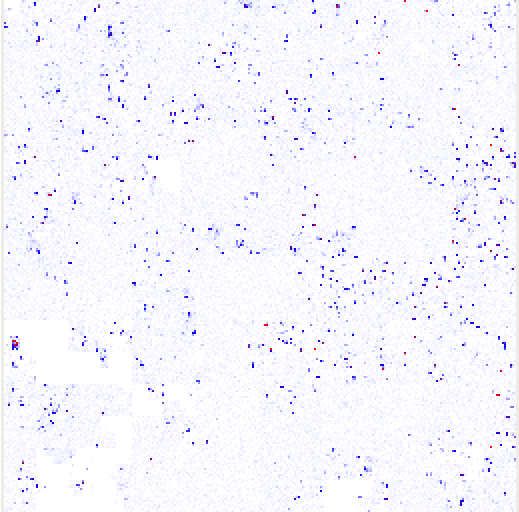
The shade of each pixel represents the value for the corresponding bin of consecutive genomic positions, calculated according to the specified summarization mode. The pixels are arranged so that bins that are close to each other on the data vector are represented by pixels that are close to each other in the plot. In particular, adjacent bins are mapped to adjacent pixels. Hence, dark spots in a figure represent a peak; the area of the spot in the two-dimensional plot is proportional to the width of the peak in the one-dimensional data, and the darkness of the spot corresponds to the height of the peak.
The input file is in interval format, and typically contains a column with scores or other numbers, such as conservation scores, SNP density, the coverage of aligned reads from ChIP-Seq data, etc.
Website: http://www.ebi.ac.uk/huber-srv/hilbert/
Examples
Here are some examples from the HilbertVis homepage, using ChIP-Seq data.
Reference
Anders S. (2009) Visualization of genomic data with the Hilbert curve. Bioinformatics. 25(10):1231-5. Epub 2009 Mar 17.