Authors Marie Tremblay-Franco (marie.tremblay-franco@inra.fr), Patrick Tardivel (patrick.tardivel@inra.fr), Rémi Servien (remi.servien@inra.fr) and Gaelle Lefort (gaelle.lefort@inra.fr)
Please cite
Tardivel P., Servien R. and Concordet D. Non asymptotic active set properties of lasso-type estimators in small-dimension (submitted) Tardivel P., Servien R., Canlet C., Tremblay-Franco M., Debrauwer L. and Concordet D. ASICS: an automatic method for identification and quantification of metabolites in NMR 1D 1H spectra (in preparation)
NMR Annotation
Description
ASICS, based on a strong statistical theory, handles automatically the metabolite identification and quantification
Workflow position
Upstream tools
| Name | output file | format | parameter |
|---|---|---|---|
| NA | NA | NA | NA |
Downstream tools
| Name | output file | format | parameter |
|---|---|---|---|
| NA | NA | NA | NA |
Input files
| Parameter : num + label | Format |
|---|---|
| 1 : Choose your inputs | zip |
Choose your inputs
You have two methods for your inputs:

Parameters
Exclusion zone(s) | Spectral regions to exclude, water, solvent or contaminant resonances | If YES: parameters Lower exclusion zone and Upper exclusion zone are visible, | If NO: no zone to exclude | Default value is NO |
Left exclusion zone | Upper boundary of exclusion zone
Right exclusion zone | Lower boundary of exclusion zone
Shift | Maximum variation of the chemical shift (due to experimental conditions) of a peak of a fixed metabolite allowed in the warping function
Graphical zone(s) | Spectral regions to display | If YES: parameters Lower graphical zone and Upper graphical zone are visible, | If NO: no zone to display | Default value is NO
Output files
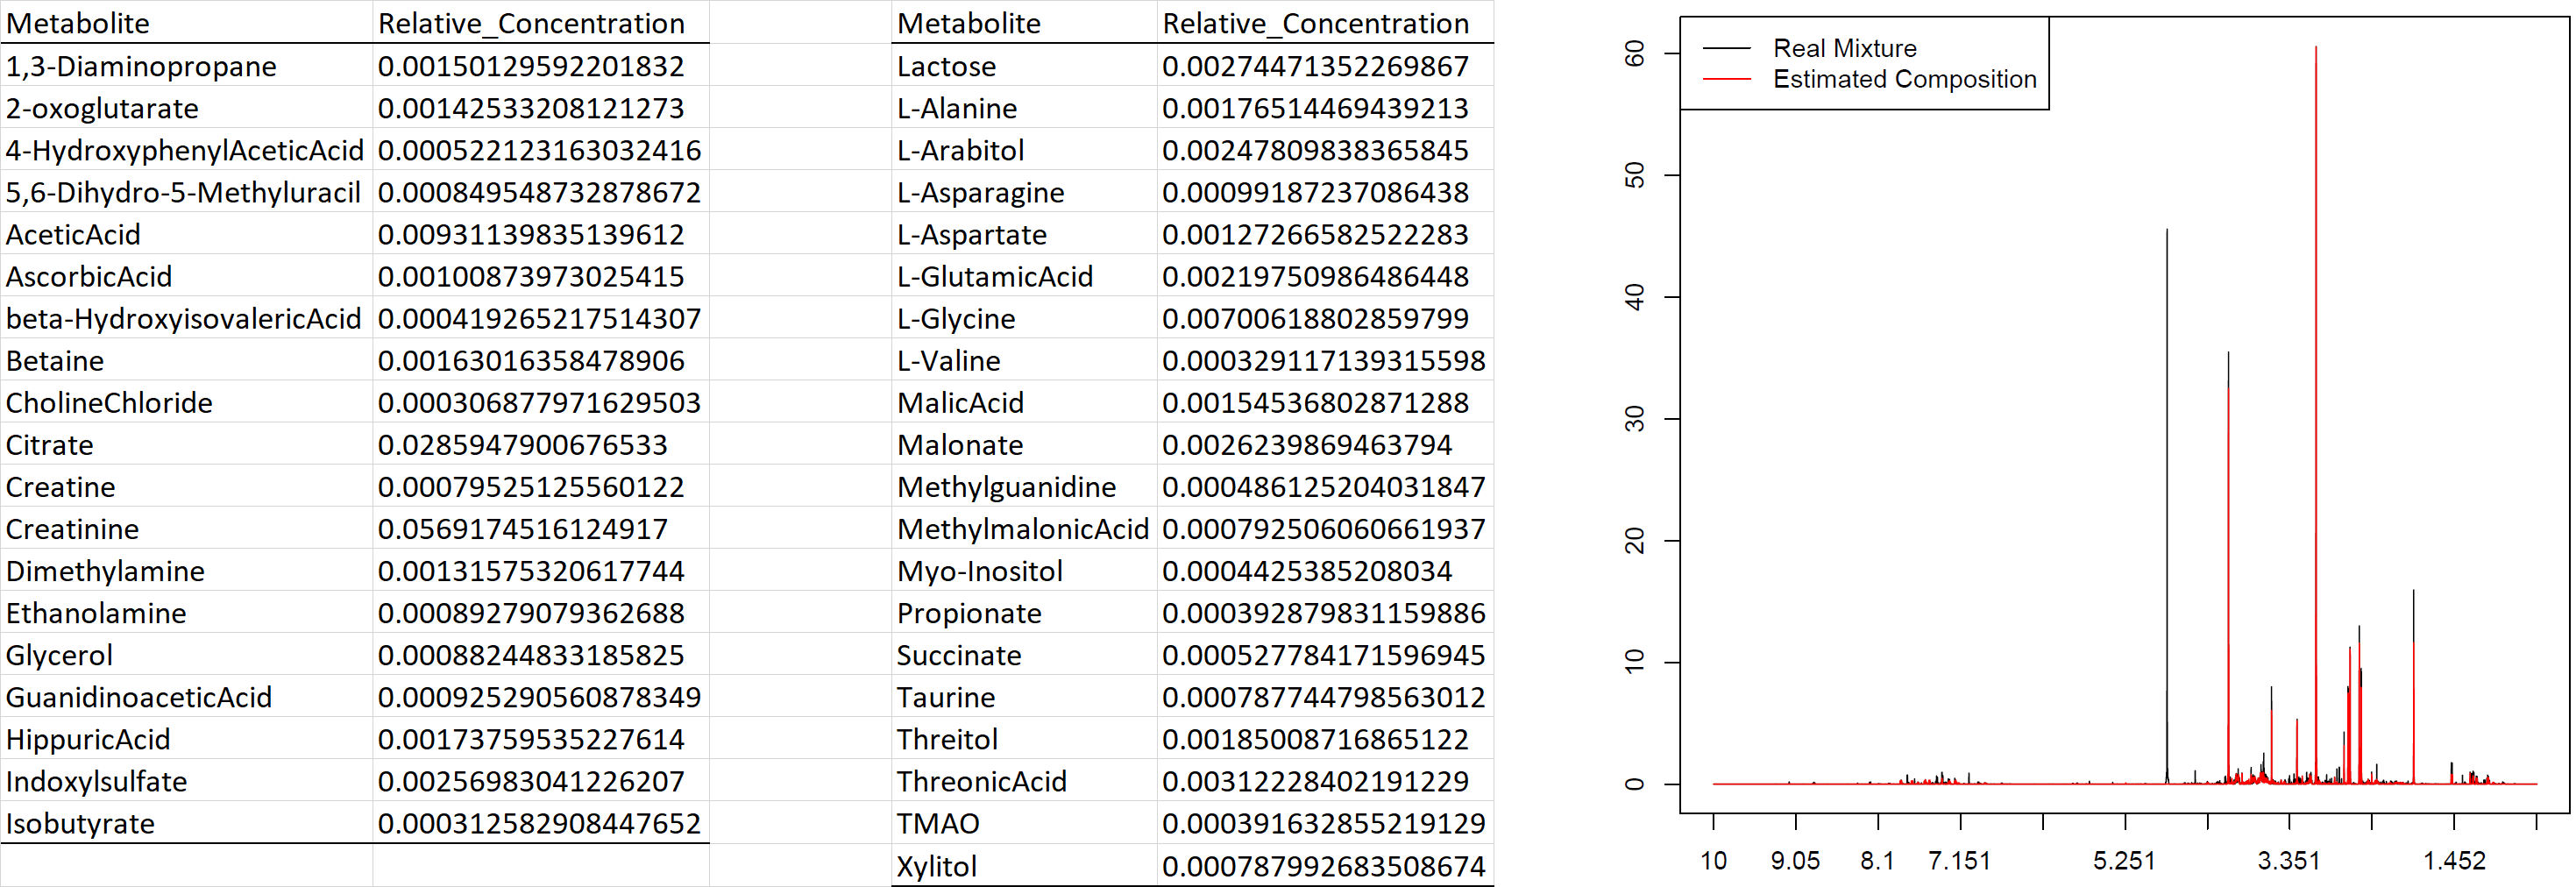
proportionEstimation.tsv | tabular output | Array with p rows (corresponding to the identified metabolites) and 1 column containing the estimated relative intensities
spectra.pdf | pdf output | Graphical chart of real and estimated spectrum (whole spectral width and zooms depending on exclusion zone(s))
Example