What it does
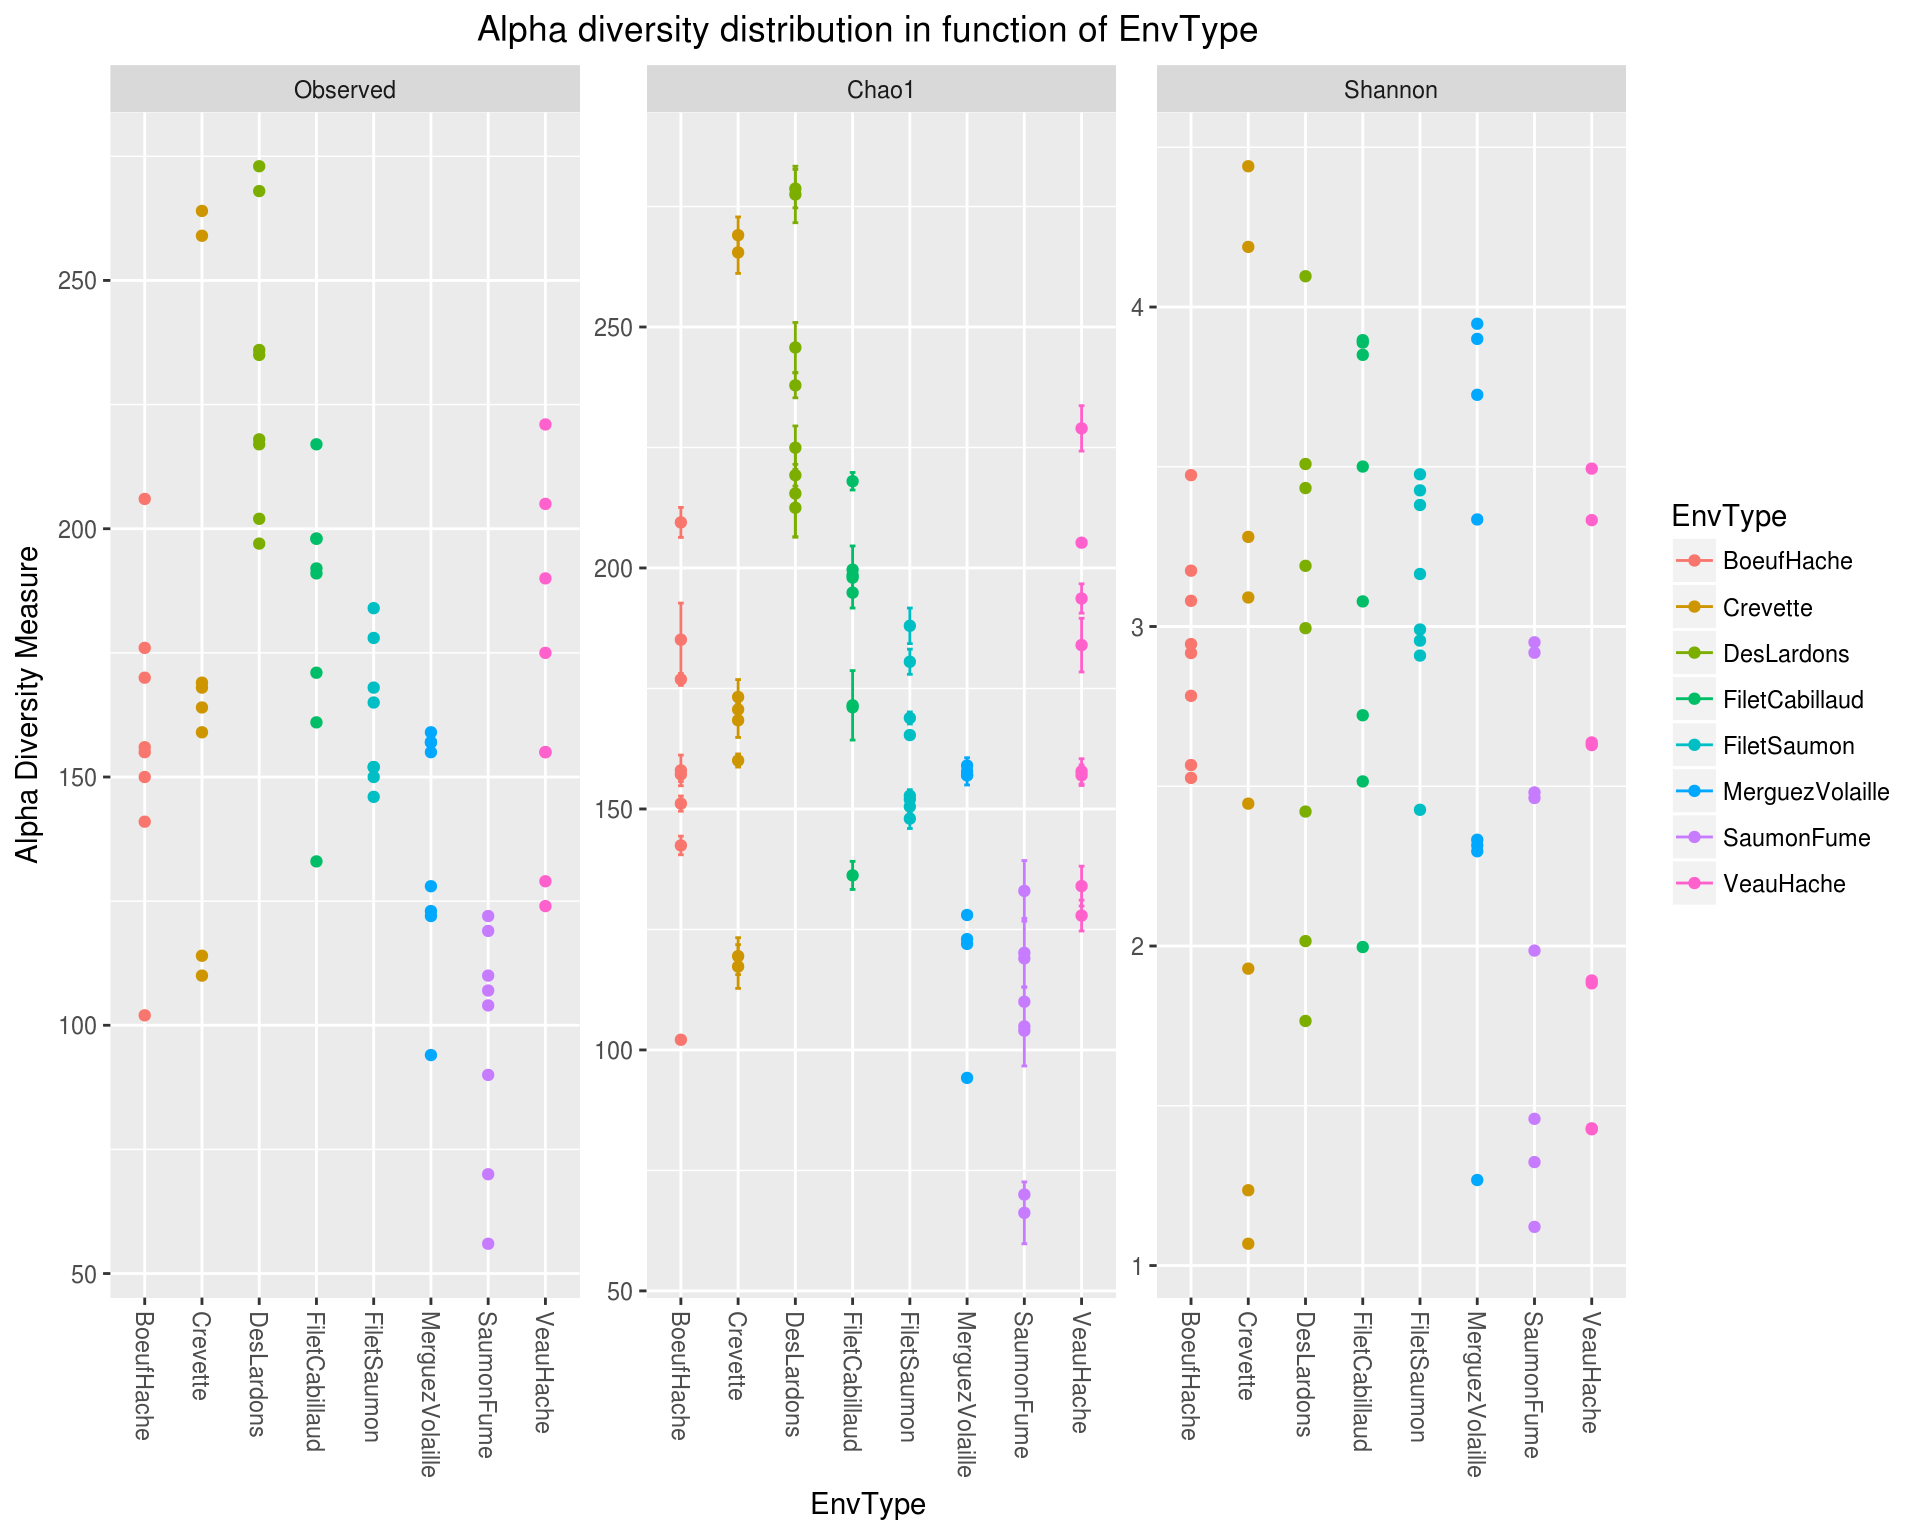
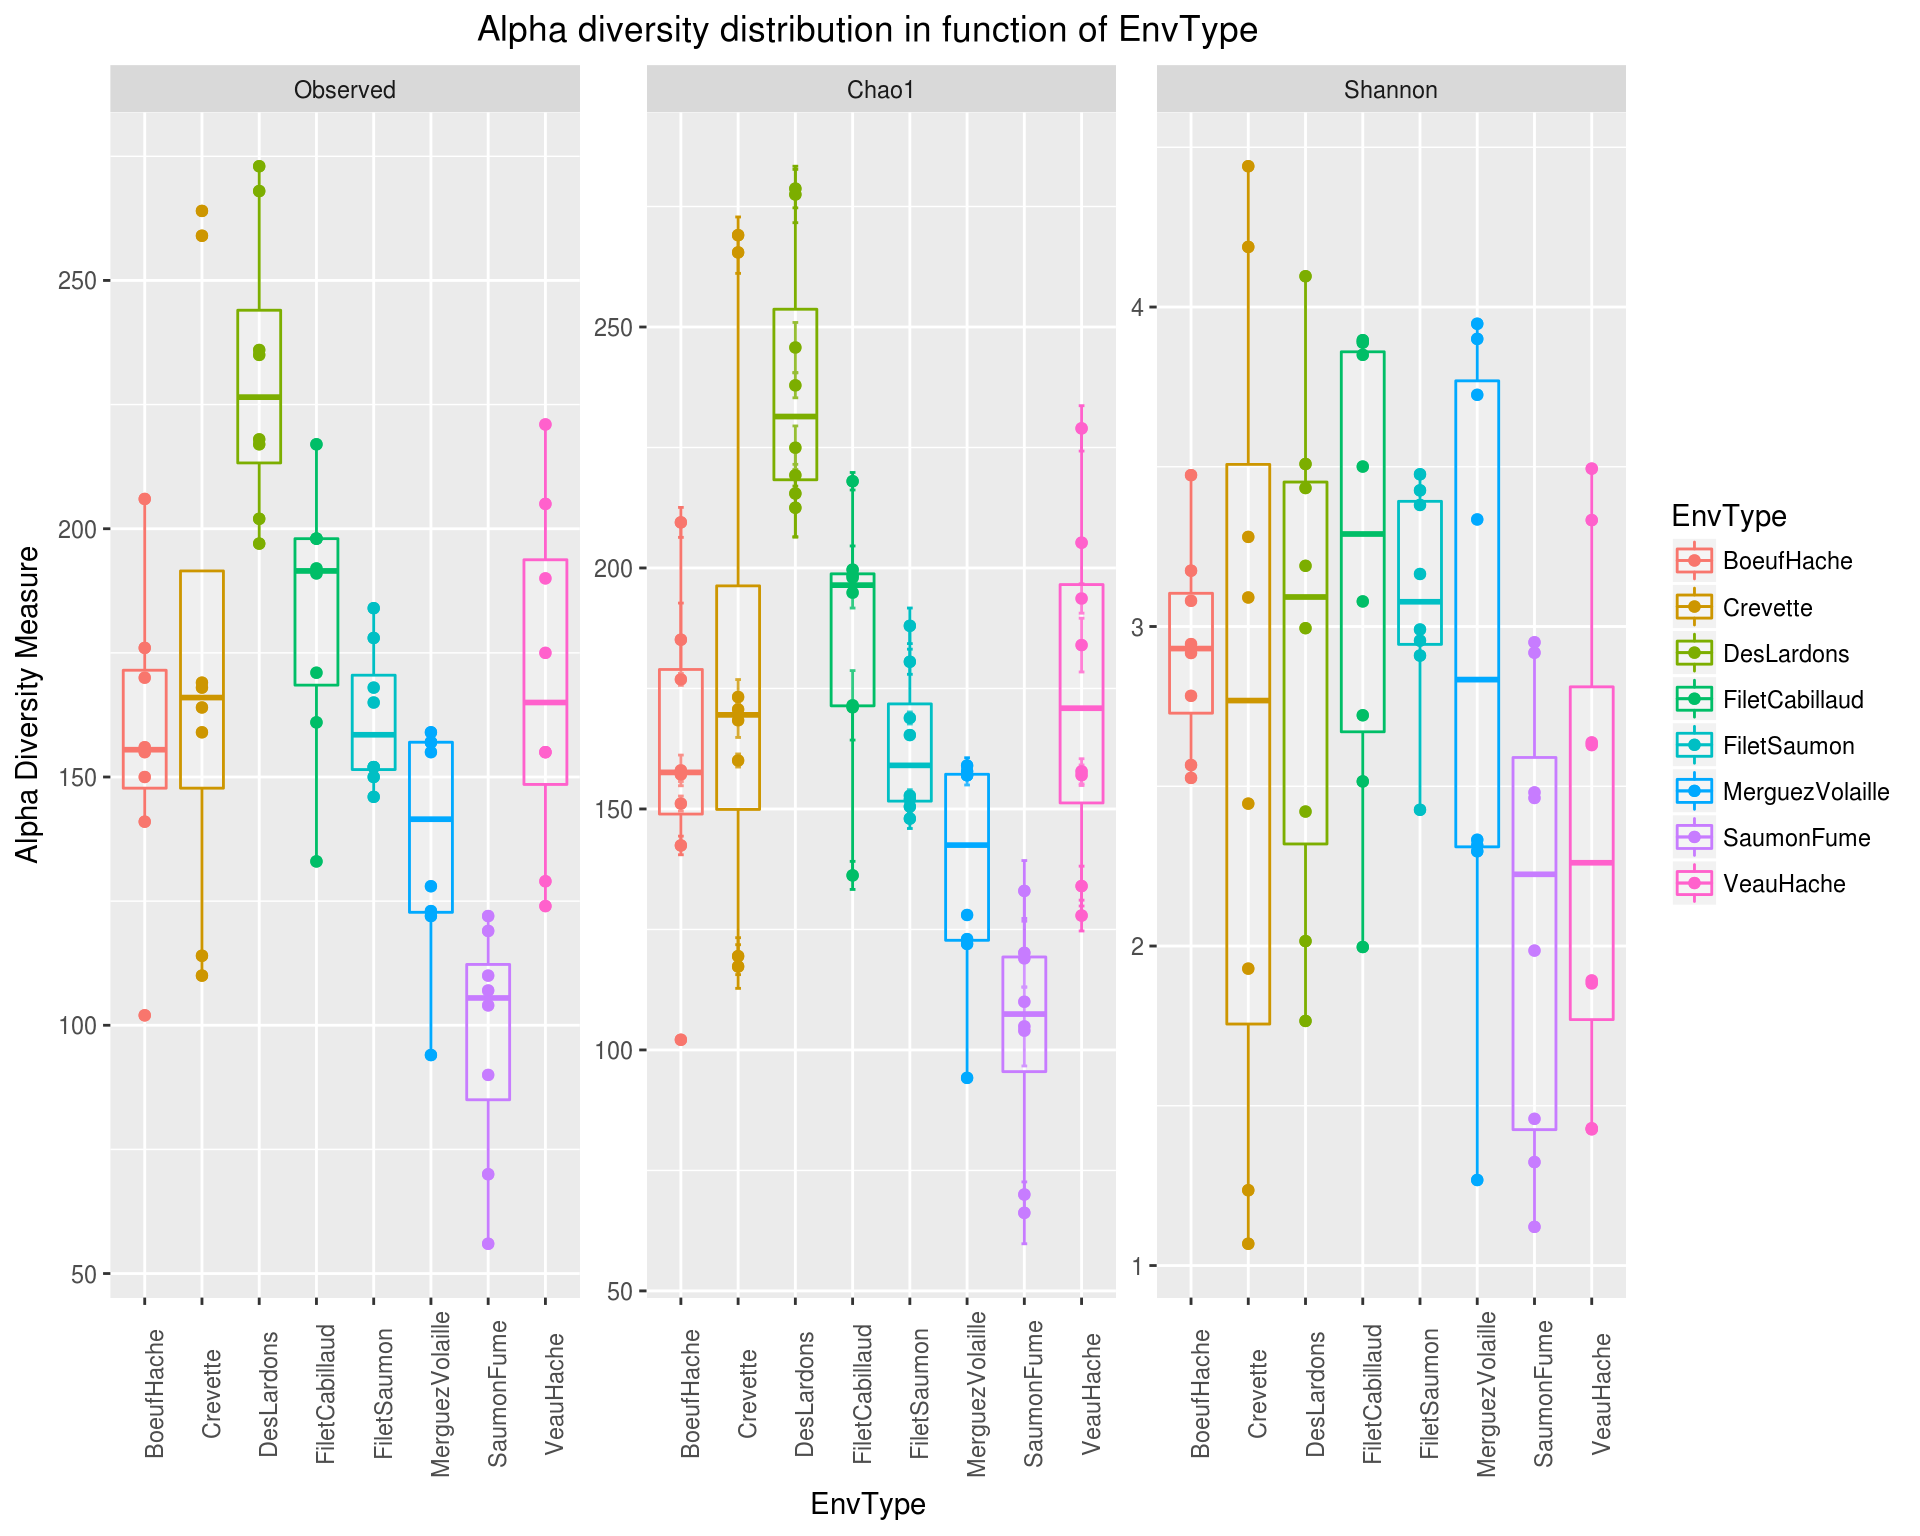
Using phyloseq and customized R function, this tool constructs richness plots to visualise sample alpha diversity.
Inputs/Outputs
Input
Data file (format RData): One phyloseq object containing OTU abundance table, their taxonomies (and optionnaly a phylogenetics tree, and the sample experiment metadata. This file is the result of "FROGS Phyloseq Import Data tool".
Output
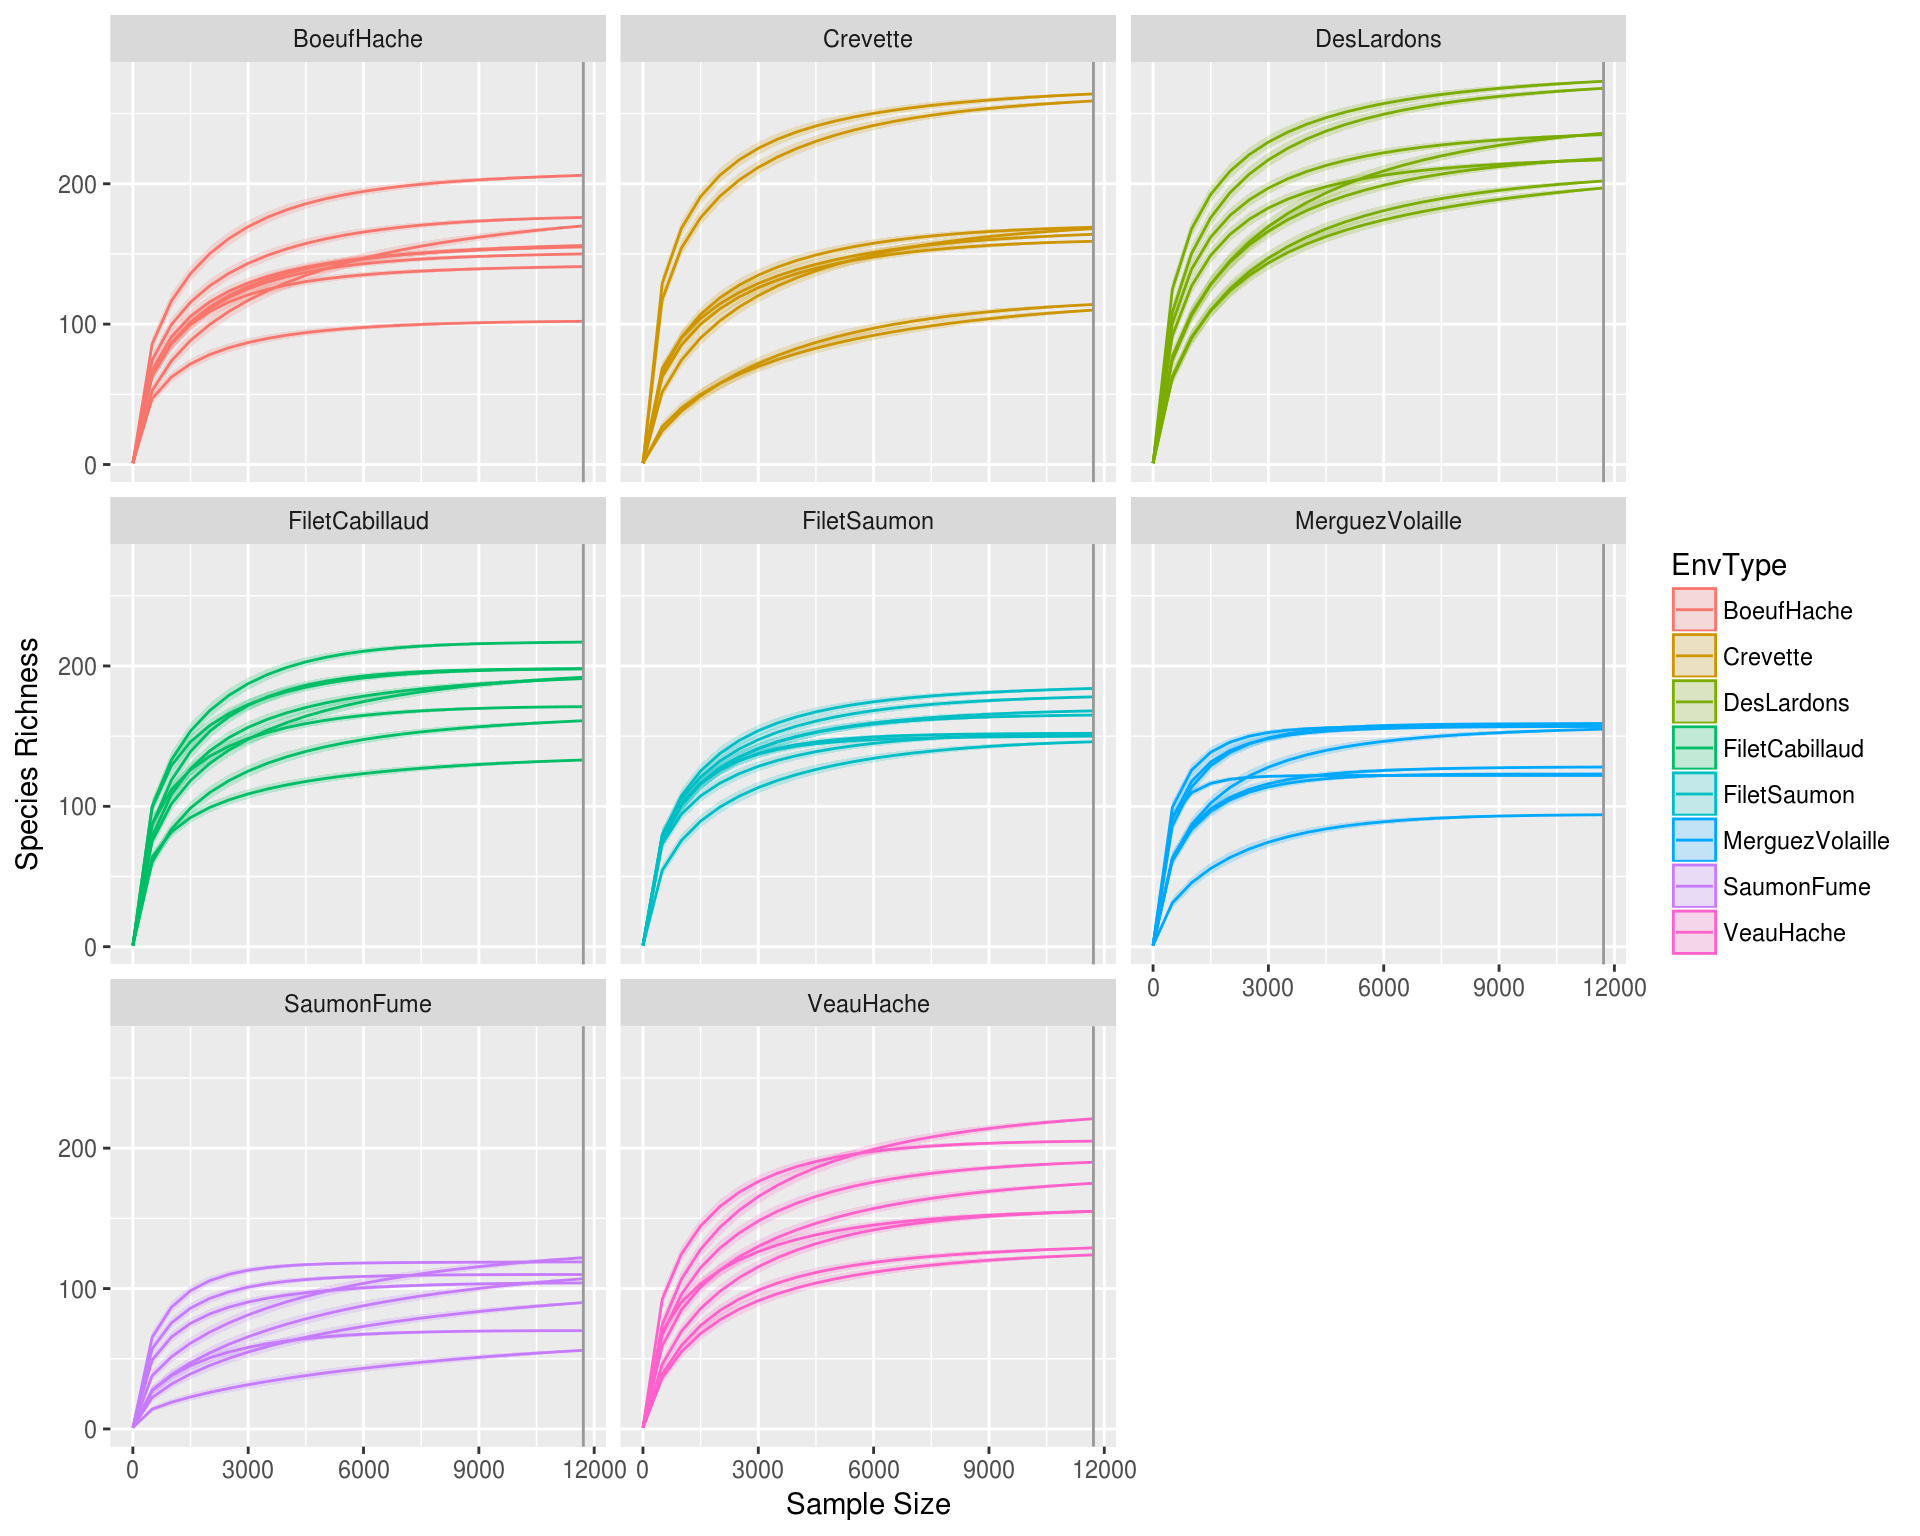
Html file (format HTML): the review of richness plots and rarefaction curves.
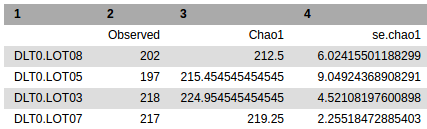
Alpha diversity table (alpha_diversity.tsv): The data file containing table of alpha diversity indices.
Contact
Contacts: frogs@inra.fr
Repository: https://github.com/geraldinepascal/FROGS
Please cite the FROGS Publication: Escudie F., Auer L., Bernard M., Cauquil L., Vidal K., Maman S., Mariadassou M., Combes S., Hernandez-Raquet G., Pascal G., 2016. FROGS: Find Rapidly OTU with Galaxy Solution. In: ISME-2016 Montreal, CANADA , http://bioinfo.genotoul.fr/wp-content/uploads/FROGS_ISME2016_poster.pdf
Depending on the help provided you can cite us in acknowledgements, references or both.