What it does
Using phyloseq and customized R function, this tool compute beta distance matrix and display them in a heatmap
Inputs/Outputs
Input
data file (format RData): One phyloseq object containing OTU abundance table, their taxonomies and optionnaly a phylogenetic tree, and the sample experiment metadata. This file is the result of "FROGS Phyloseq Import Data tool".
distance methods : The list of Phyloseq distanceMethodList is available here distanceMethodList . You have to copy the exact name as in this list in the parameter window "Other Method". To use several methods, separate them by a space.
Output
html file (format HTML):
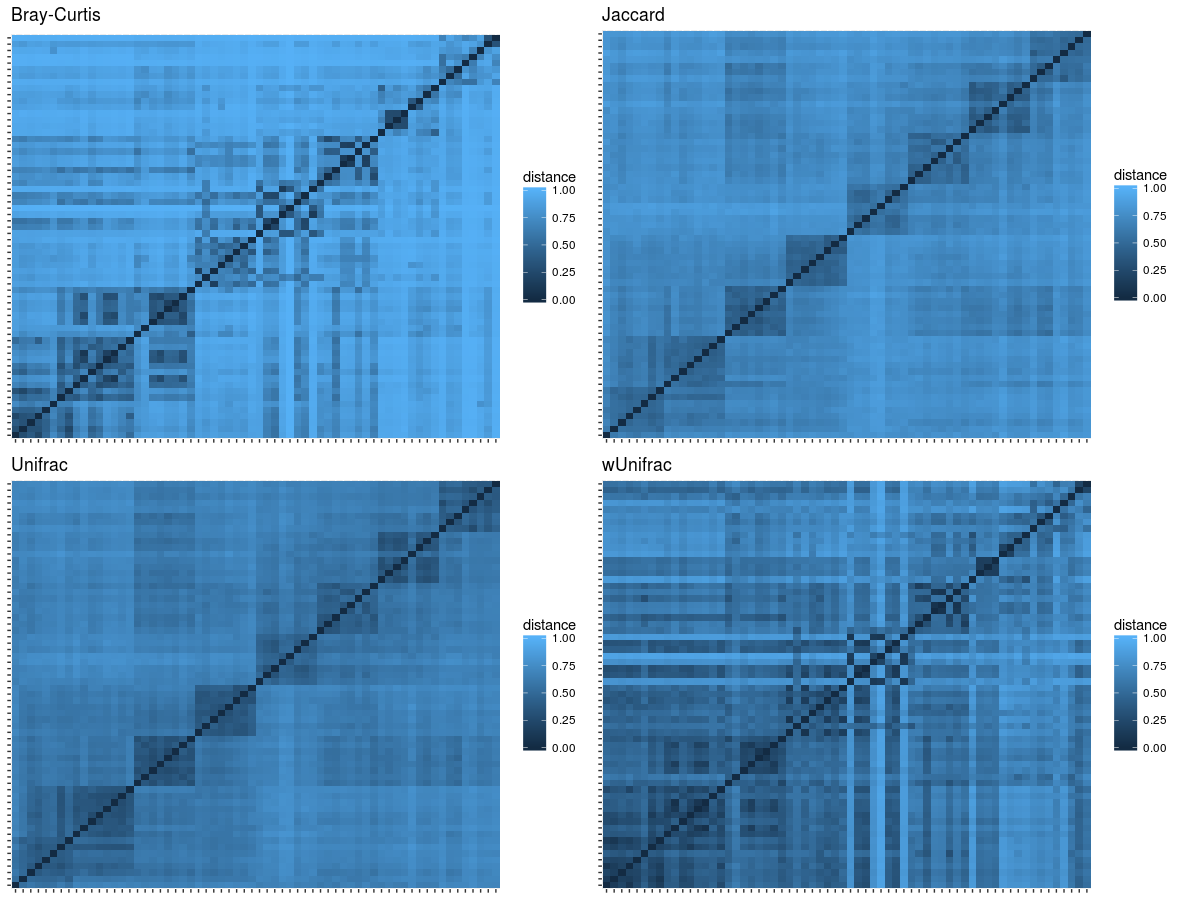
The review of beta diversity with heatmap plots:
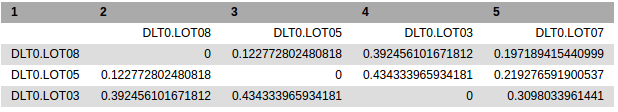
beta diversity matrix (format tabular): The distance matrix of beta diversity.
Contact
Contacts: frogs@inra.fr
Repository: https://github.com/geraldinepascal/FROGS
Please cite the FROGS Publication: Escudie F., Auer L., Bernard M., Cauquil L., Vidal K., Maman S., Mariadassou M., Combes S., Hernandez-Raquet G., Pascal G., 2016. FROGS: Find Rapidly OTU with Galaxy Solution. In: ISME-2016 Montreal, CANADA , http://bioinfo.genotoul.fr/wp-content/uploads/FROGS_ISME2016_poster.pdf
Depending on the help provided you can cite us in acknowledgements, references or both.