What it does
Using phyloseq and custom R function, this tool constructs two plots to visualise the sample composition: one at the OTU level and another one at the specified aggregation level (e.g. Phylum) after keeping only a subset of taxa (e.g. Bacteria at the level Kingdom). It helps answer the question: "What is the composition at the Phylum level within Bacteria?". By default, the plot exhibits only the abundance of the 9 most abundant taxa (as specified). In general, the representation of more than 10 taxa is hard to read on plots.
Inputs/Outputs
Input
data file (format rdata): One phyloseq object containing the OTU abundance table, their taxonomies and optionnaly a phylogenetic tree, and the sample experiment metadata. this file is the result of FROGS Phyloseq Import Data tool.
Output
html file (format HTML): data composition plots.
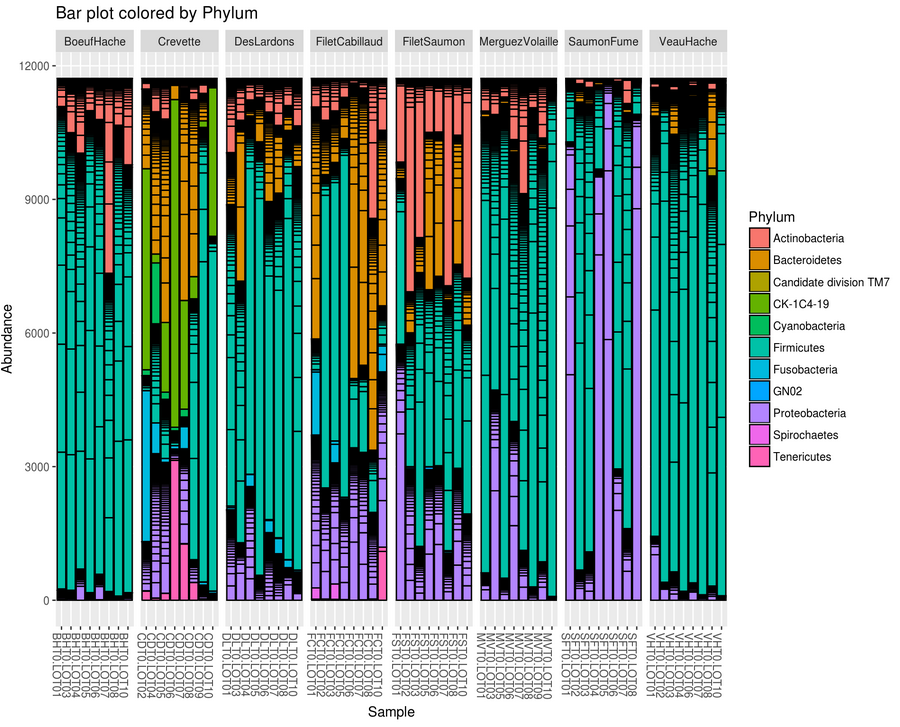
Bar plot of OTUs is colored with aggregated taxonomic level i.e "Phylum" :
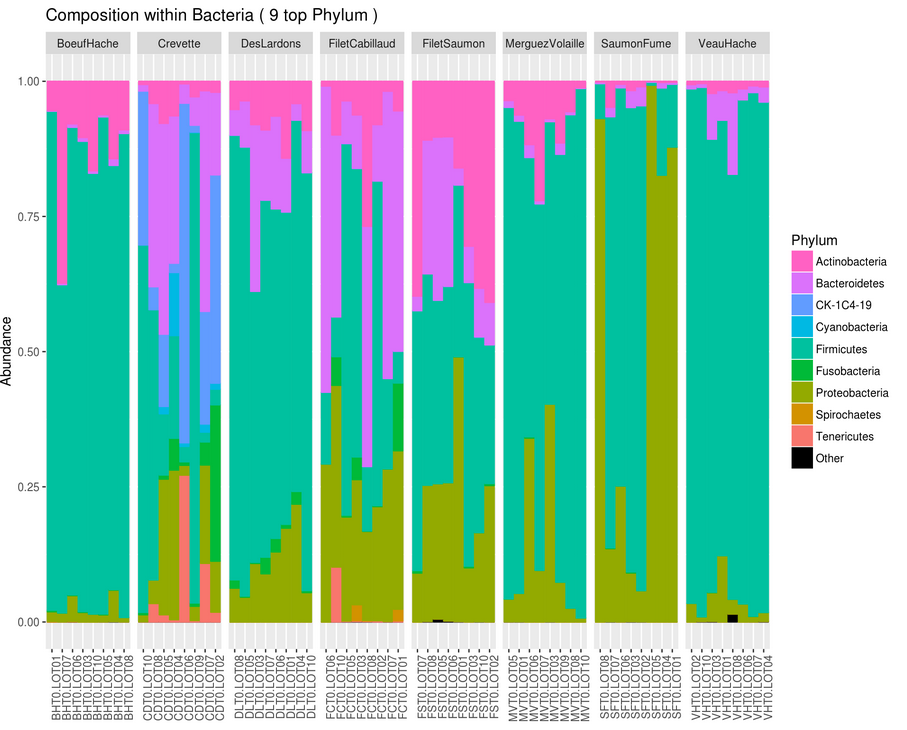
Composition plot: plot the most abundant sub taxonomic level among a selection of OTUs.
Selection of OTUs:
- Taxonomic level name to subset: Kingdom
- Taxon name: Bacteria
Aggregation of OTUs :
- Taxonomic level used to agglomerate: Phylum
Number of the most abundant taxa to keep: 5
Contact
Contacts: frogs@inra.fr
Repository: https://github.com/geraldinepascal/FROGS
Please cite the FROGS Publication: Escudie F., Auer L., Bernard M., Cauquil L., Vidal K., Maman S., Mariadassou M., Combes S., Hernandez-Raquet G., Pascal G., 2016. FROGS: Find Rapidly OTU with Galaxy Solution. In: ISME-2016 Montreal, CANADA , http://bioinfo.genotoul.fr/wp-content/uploads/FROGS_ISME2016_poster.pdf
Depending on the help provided you can cite us in acknowledgements, references or both.