Tool updates
See the NEWS section at the bottom of this page
Authors Marie Tremblay-Franco (W4M Core Development Team, MetaboHUB Toulouse, AXIOM) and Yann Guitton (W4M Core Development Team, Laberca, UM1329)
References | R Core Team (2013). R: A language and environment for statistical computing. R Foundation for Statistical Computing, Vienna, Austria (http://www.r-project.org) | Tim Dorscheidt (2013). MetStaT: Statistical metabolomics tools. R package version 1.0. https://CRAN.R-project.org/package=MetStaT |
A-SCA
Description
ASCA splits variance into independent blocks according to the experimental factors and performs multivariate analysis (SCA) of each block
Workflow position

Input files
| Parameter : num + label | Format |
|---|---|
| 1 : Data matrix file | tabular |
| 2 : Sample metadata file | tabular |
| 3 : Variable metadata file | tabular |
The required formats for the dataMatrix, sampleMetadata, and variableMetadata files are described in the HowTo entitled 'Format Data For Postprocessing' available on the main page of Workflow4Metabolomics.org (http://web11.sb-roscoff.fr/download/w4m/howto/w4m_HowToFormatDataForPostprocessing_v02.pdf)
Parameters
- Data matrix file
- variable x sample dataMatrix tabular separated file of the numeric data matrix, with . as decimal, and NA for missing values; the table must not contain metadata apart from row and column names; the row and column names must be identical to the rownames of the sample and variable metadata, respectively (see below)
- Sample metadata file
- sample x metadata sampleMetadata tabular separated file of the numeric and/or character sample metadata, with . as decimal and NA for missing values
- Variable metadata file
- variable x metadata variableMetadata tabular separated file of the numeric and/or character variable metadata, with . as decimal and NA for missing values
- Factor1
- Name of the sampleMetadata column containing the 1st factor for A-SCA
- Factor2
- Name of the sampleMetadata column containing the 2nd factor for A-SCA
- Scaling (default = none)
- Mean-centering followed either by pareto scaling (pareto), or unit-variance scaling (UV)
- Permutation testing for A-SCA parameters: Number of permutations (default = 100)
- Number of random permutation on the results from ASCA. Calculate by repeating the ASCA analysis many times with permutated samples.
- Threshold
- p-value significance threshold for permutation test
Output files
- sampleMetadata_out.tabular
- sampleMetadata data file; may be identical to the input sampleMetadata in case no renaming of sample names nor re-ordering of samples (see the 'information' file for the presence/absence of modifications)
- variableMetadata_out.tabular
- variableMetadata data file; may be identical to the input variableMetadata in case no renaming of variable names nor re-ordering of variables (see the 'information' file for the presence/absence of modifications)
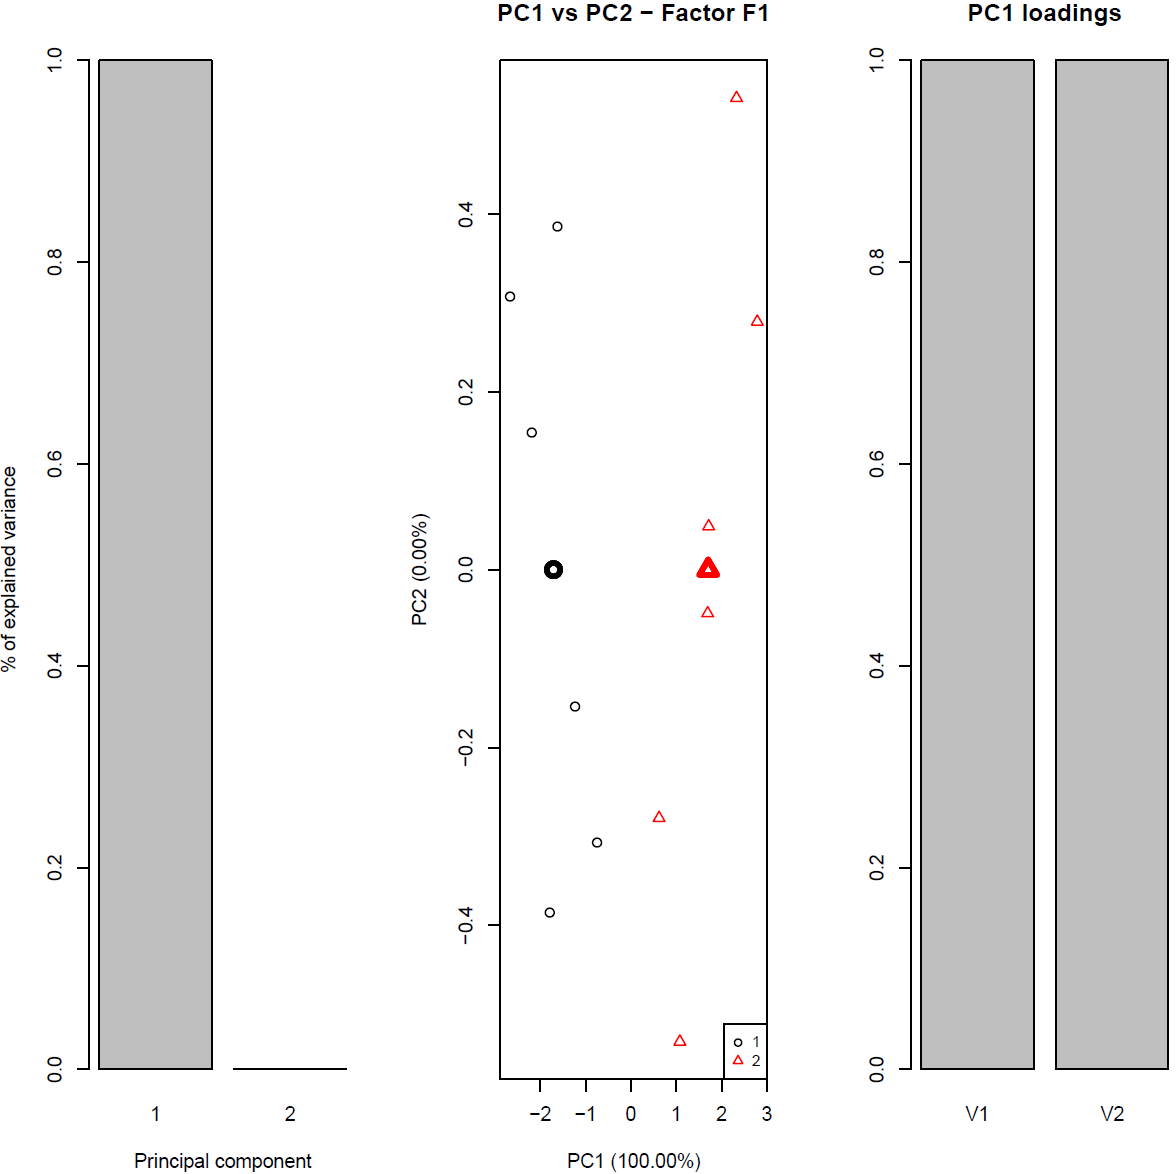
- figure.pdf
- Scree and score plots for significant parameter(s)
- information.txt
- Text file with all messages when error(s) in formats are detected
Working example
Data used in the following example comes from the Biosystems Data Analysis Group. They ayre included in the ASCA software(http://www.bdagroup.nl/content/Downloads/software/software.php).
Two features were measured on 12 individuals, using a two factor-experimental design. The 1st factor has 2 levels and the 2nd factor has 3 levels.
Input files
| Datamatrix | Ind1 | Ind2 | Ind3 | Ind4 | Ind5 | Ind6 | Ind7 | Ind8 | Ind9 | Ind10 | Ind11 | Ind12 |
|---|---|---|---|---|---|---|---|---|---|---|---|---|
| V1 | 1.00 | 3.00 | 2.00 | 1.00 | 2.00 | 2.00 | 4.00 | 6.00 | 5.00 | 5.00 | 6.00 | 5.00 |
| V2 | 0.60 | 0.40 | 0.70 | 0.80 | 0.01 | 0.80 | 1.00 | 2.00 | 0.90 | 1.00 | 2.00 | 0.70 |
| sampleMetadata | F1 | F2 |
|---|---|---|
| Ind1 | 1 | 1 |
| Ind2 | 1 | 1 |
| Ind3 | 1 | 2 |
| Ind4 | 1 | 2 |
| Ind5 | 1 | 3 |
| Ind6 | 1 | 3 |
| Ind7 | 2 | 1 |
| Ind8 | 2 | 1 |
| Ind9 | 2 | 2 |
| Ind10 | 2 | 2 |
| Ind11 | 2 | 3 |
| Ind11 | 2 | 3 |
| Variablemetadata | Number |
|---|---|
| V1 | 1 |
| V2 | 2 |
Parameters
Name of the sampleMetadata column containing the 1st factor for A-SCA: F1Name of the sampleMetadata column containing the 2nd factor for A-SCA: F2Scaling to apply to dataMatrix: noneNumber of permutation to perform to compute factor significance: 500Threshold for factor significance (permutation test): 0.05
Output files
1) Example of a ASCA_BDAGroup_ASCA_samplemetadata.tsv: tsv file including PC1 and PC2 scores from F1 PCA, F2 PCA and F1xF2 PCA
| sampleMetadata | F1 | F2 | F1_XSCOR-p1 | F1_XSCOR-p2 | F2_XSCOR-p1 | F2_XSCOR-p2 | Interact_XSCOR-p1 | Interact_XSCOR-p1 |
|---|---|---|---|---|---|---|---|---|
| Ind1 | 1 | 1 | -2.66136390 | 0.307505352 | 0.986520075 | -0.25138715 | -0.31885686 | -0.77109078 |
| Ind2 | 1 | 1 | -0.74779084 | -0.30750535 | -0.99758505 | 0.070057773 | 0.719240017 | 0.950058502 |
| Ind3 | 1 | 2 | -1.22618411 | -0.15375267 | -0.24288670 | 0.124191016 | -0.00883820 | 0.465391498 |
2) Example of a ASCA_BDAGroup_ASCA_variablemetadata.tsv: tsv file including PC1 and PC2 loadings from F1 PCA, F2 PCA and F1xF2 PCA
| variableMetadata | Number | F1_XLOAD-p1 | F1_XLOAD-p2 | F2_XLOAD-p1 | F2_XLOAD-p2 | Interact_XLOAD-p1 | Interact_XLOAD-p1 |
|---|---|---|---|---|---|---|---|
| V1 | 1 | 0.977759467 | -0.20972940 | -0.99814337 | 0.060908126 | 0.428703939 | 0.903445035 |
| V2 | 2 | 0.977759467 | -0.30750535 | -0.06090812 | -0.99814337 | -0.90344503 | 0.428703939 |
3) Example of a ASCA_information.txt: txt file including % of explained variance and p-value of permutation test
| ASCA_information.txt | % of explained variance | Permutation p-value |
|---|---|---|
| F1 | 81.71 | 0.004 |
| F2 | 1.29 | 0.880 |
| Interaction | 1.33 | 0.962 |
| Residuals | 15.67 |
4) Example of ASCA_figure.pdf: pdf file including Scree, Score plot and barplot of leverage values only for significant factor(s)/interaction**Leverage: importance of a variable in the PCA model (Nueda et al. 2007)