Galaxy | Tool Preview

Plot grouped barplot (version 0.1.0)
File in tabular format with tab-separated columns and header in first line (--input_file)
(--header)
Add sample information (column id, name, color)s
Add sample information (column id, name, color) 0
(--replace_null)
(--order)
(--names_column)
(--xlab)
(--log)
(--bottom_margin)
(--left_margin)
(--top_margin)
(--right_margin)

What it does

This tool plot a grouped barplot with multiple data:

/repository/static/images/5ac284dbf7f2c05c/output.png

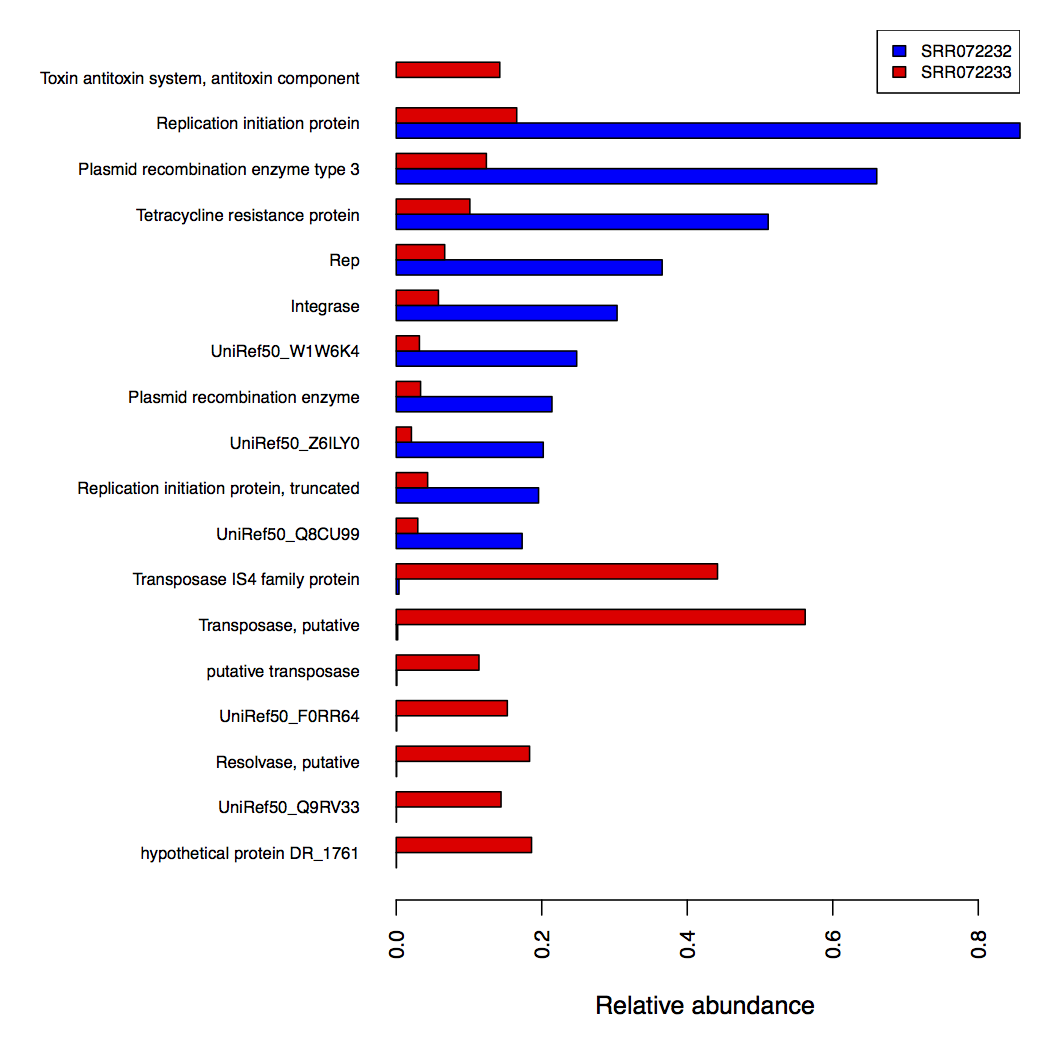
This tool relies on R's barplot function. The input file must be a tabular file with multiple columns: a column with row names (for bar names) and a least a column with data. The output image is customizable (margin, legend positions, ...) and can be export in different format.