Circos
Made a nice plot? Share it with us in the training materials, we're looking for more cool plots with scientifically relevant stories to share with the students who want to learn how to use Circos.
Have a feature request? Share it with us!
No data or plot crashes? Check that your chromosome naming scheme matches between your Karyotype file and your datasets.
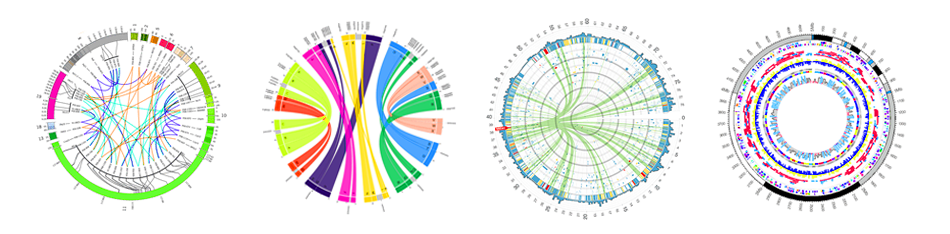
Circos is a software package for visualizing data and information. It visualizes data in a circular layout — this makes Circos ideal for exploring relationships between objects or positions. There are other reasons why a circular layout is advantageous, not the least being the fact that it is attractive.
Circos is ideal for creating publication-quality infographics and illustrations with a high data-to-ink ratio, richly layered data and pleasant symmetries. You have fine control each element in the figure to tailor its focus points and detail to your audience.
For more information see the Circos documentation.