Author Etienne Thevenot (W4M Core Development Team, MetaboHUB Paris, CEA)
References
Tool updates
See the NEWS section at the bottom of this page
Heatmap
Description
Performs hierarchical clustering on both the samples (rows) and variables (columns) of the dataMatrixDisplays the dataMatrix with sorted rows and samples and the dendrograms (heatmap)In the output dataMatrix, sampleMetadata and variableMetadata files sample and variables are sorted according to the dendrogramsOptionally, indicates the groups of samples and/or variables obtained by cutting the dendrograms into a specific number of partitionsNote: 1) Computations rely on the 'hclust' function. The dissimilarity is 1 - cor (where cor is the Spearman correlation) and the 'ward.D' aggregating method is used.2) A "blue-orange-red" palette is generated with the function 'colorRampPalette'; By default, variables are standardized (mean-centered and unit-scaled) to enhance contrast on the figure; standardization can be turned off by using the full list of parameters; in any case, standardizing is performed after the computation of clusters, for display only3) When a specific number of sample and/or variable groups (i.e. > 1) are selected, the group numbers are indicated on the plot and in an additional 'heat_clust" column in the sampleMetadata and/or variableMetadata4) Example of computation times: for 126 variables: a few seconds; for 4324 variables: 30 min
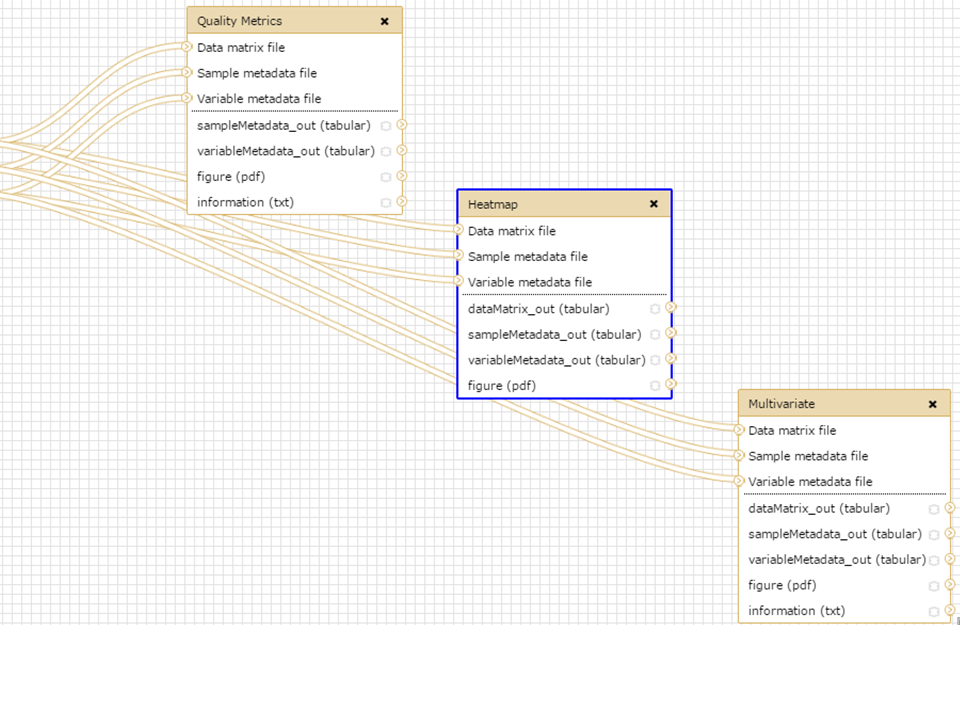
Workflow position
Input files
| File type | Format |
|---|---|
| 1 : Data matrix | tabular |
| 2 : Sample metadata | tabular |
| 3 : Variable metadata | tabular |
Parameters
- Number of sample clusters
- By default (cluster = 1), only dendrograms are displayed; when a specific number of sample clusters is selected, the sample dendrogram is cut at the corresponding level: the sample groups are displayed on the dendrogram and a "heat_clust" column is added in the sampleMetadata file with the group of each sample
- Number of variable clusters
- Same as above for variables
- Standardization (Full list)
- By default, variables are standardized for display to enhance contrast of the heatmap (note that standardization is performed after the clustering for display only and does not modify cluster computation nor intensities in the output files)
- Size of labels (Full list)
- The size of sample and variable names on the heatmap is 0.8 (note that names with more than 14 characters are truncated); this number may be lowered (or uppered) in case of many (few) names to display
Output files
- dataMatrix_out.tabular
- dataMatrix file with rows and columns sorted according to the dendrogram
- sampleMetadata_out.tabular
- sampleMetadata file with rows sorted according to the sample dendrogram; in case a number of sample groups is specified, and additional "heat_clust" column is added with the cluster group of each sample
- variableMetadata_out.tabular
- variableMetadata file with rows sorted according to the variable dendrogram; in case a number of variable groups is specified, and additional "heat_clust" column is added with the cluster group of each variable
- figure.pdf
- Heatmap
- information.txt
- File with all messages and warnings generated during the computation
Working example
See the W4M00001a_sacurine-subset-statistics shared history in the Shared Data/Published Histories menu (https://galaxy.workflow4metabolomics.org/history/list_published)
NEWS
CHANGES IN VERSION 2.2.2
INTERNAL MODIFICATIONS
Minor internal modifications
CHANGES IN VERSION 2.2.0
NEW FEATURES
Default method for the correlation coefficient is now 'pearson', instead of 'spearman' previously (the latter can still be selected in the advanced parameters)
The 1-abs(correlation) dissimilarity is now available (in addition to the default '1-correlation') in case the sign of correlations between samples and between variables does not matter, as well as the euclidean, maximum, manhattan, canberra, binary, and minkowski dissimilarities
A new red-green color scale is available
CHANGES IN VERSION 2.1.2
INTERNAL MODIFICATIONS
Creating additional files for planemo and travis running and installation validation
CHANGES IN VERSION 2.1.1
INTERNAL MODIFICATIONS
Internal replacement of the as.hclust function which happened to produce error messages