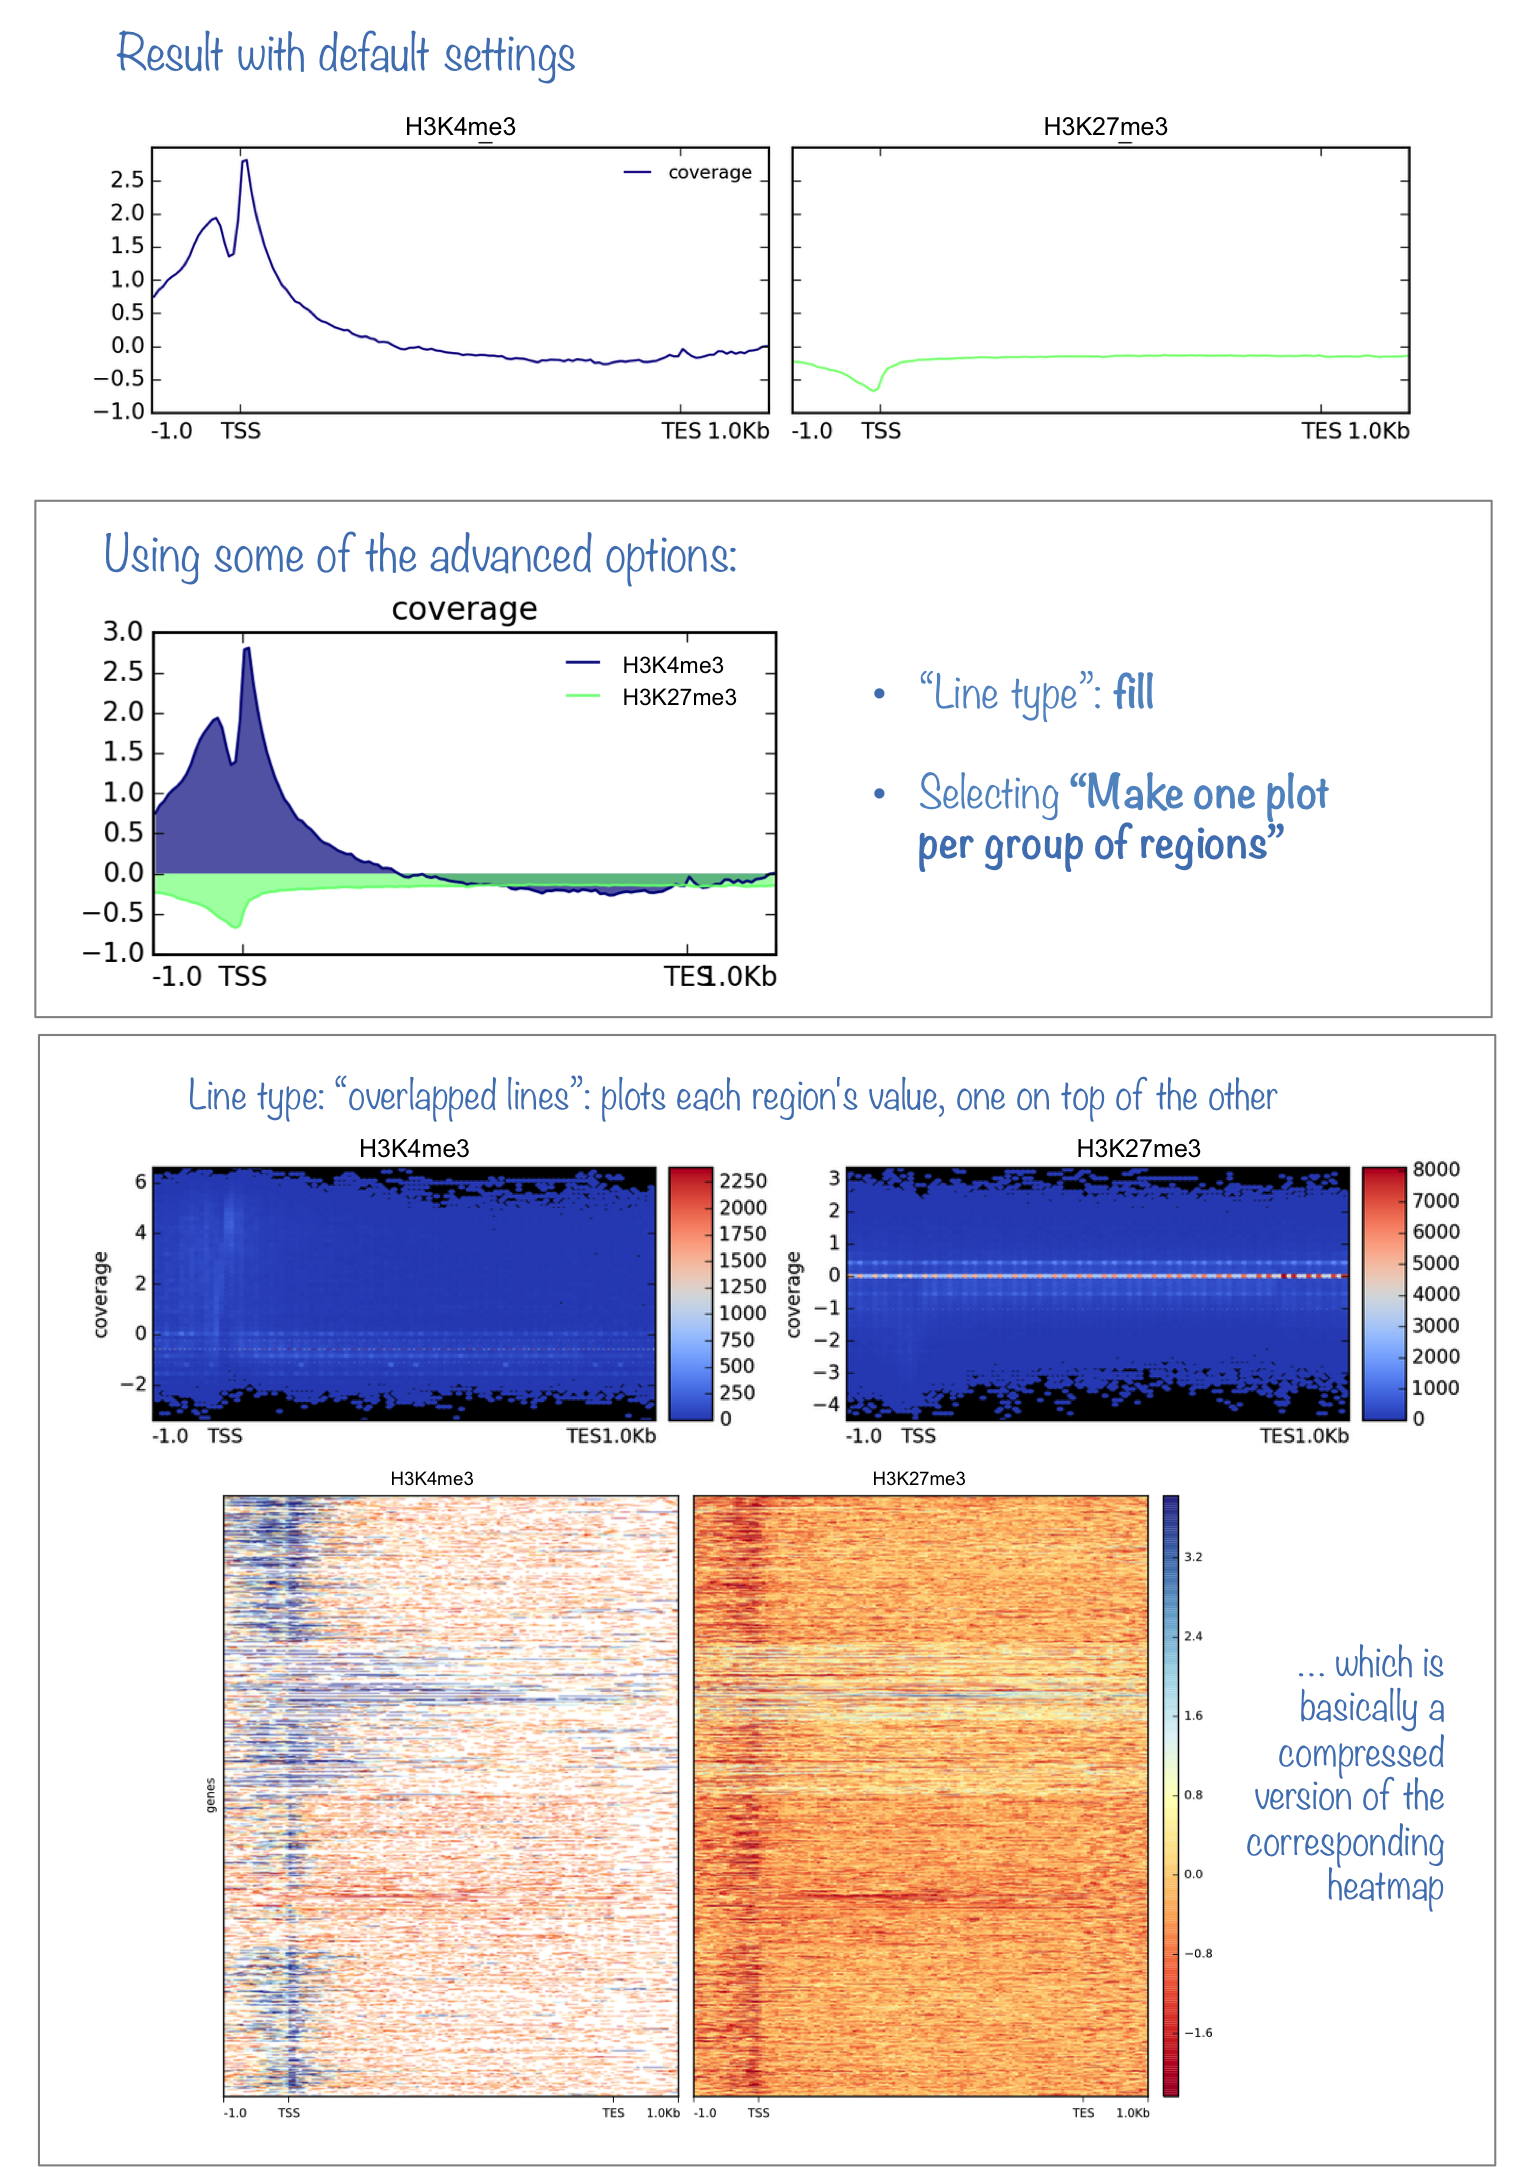
What it does
This tool plots the average enrichments over all genomic regions supplied to computeMarix. It requires that computeMatrix was successfully run. It is a very useful complement to plotHeatmap, especially in cases where you want to compare the scores for many different groups. Like plotHeatmap, plotProfile does not change the values that were computed by computeMatrix, but you can modify the color and other display properties of the plots.
Output

In addition to the image, plotProfile can also generate the values underlying the profile.
See the following table for the optional output options:
| optional output type | computeMatrix | plotHeatmap | plotProfile |
| values underlying the heatmap | yes | yes | no |
| values underlying the profile | no | no | yes |
| sorted and/or filtered regions | yes | yes | yes |
For more information on the tools, please visit our help site.
For support or questions please post to Biostars. For bug reports and feature requests please open an issue on github.
This tool is developed by the Bioinformatics and Deep-Sequencing Unit at the Max Planck Institute for Immunobiology and Epigenetics.