Summary
This function plots a histogram of the distribution of sequence complexities in the form of effective numbers of kmers as determined by seqComplexity. By default, kmers of size 2 are used, in which case a perfectly random sequences will approach an effective kmer number of 16 = 4 (nucleotides)^ 2 (kmer size).
Details
This function calculates the kmer complexity of input sequences. Complexity is quantified as the Shannon richness of kmers, which can be thought of as the effective number of kmers if they were all at equal frequencies. If a window size is provided, the minimum Shannon richness observed over sliding window along the sequence is returned.
Overview
The intended use of the dada2 tools for paired sequencing data is shown in the following image.
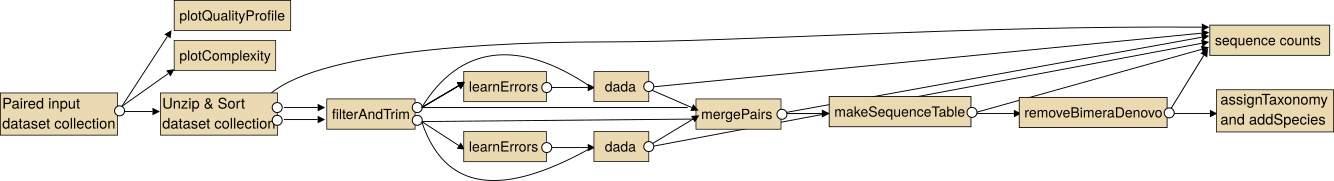
Note: In particular for the analysis of paired collections the collections should be sorted lexicographical before the analysis.
For single end data you the steps "Unzip collection" and "mergePairs" are not necessary.
More information may be found on the dada2 homepage:: https://benjjneb.github.io/dada2/index.html (in particular tutorials) or the documentation of dada2's R package https://bioconductor.org/packages/release/bioc/html/dada2.html (in particular the pdf which contains the full documentation of all parameters)