JBrowse-in-Galaxy
JBrowse-in-Galaxy offers a highly configurable, workflow-compatible alternative to Trackster.
Overview
JBrowse is a fast, embeddable genome browser built completely with JavaScript and HTML5.
The JBrowse-in-Galaxy (JiG) tool was written to help build complex JBrowse installations straight from Galaxy, taking advantage of the latest Galaxy features such as dataset collections, sections, and colour pickers. It allows you to build up a JBrowse instance without worrying about how to run the command line tools to format your data, and which options need to be supplied and where. Additionally it comes with many javascript functions to handle colouring of features which would be nearly impossible to write without the assistance of this tool.
The JBrowse-in-Galaxy tool is maintained by the Galaxy IUC, who you can help you with missing features or bugs in the tool.
Options
The first option you encounter is the Fasta Sequence(s). This option now accepts multiple fasta files, allowing you to build JBrowse instances that contain data for multiple genomes or chrosomomes (generally known as "landmark features" in gff3 terminology.) Up to 30 will be shown from the dropdown selector within JBrowse, this is a known issue.
Standalone Instances enable you to have either a complete JBrowse instance in a dataset, or just the data directory without JBrowse (e.g. for Apollo). Currently Galaxy copies the entire JBrowse directory in order to have a complete, downloadable file that contains a ready-to-go JBrowse instance. This is obviously an anti-feature because users don't want a complete copy of JBrowse (12Mb) that's duplicated for every JBrowse dataset in their history, and admins don't want useless copies of JBrowse on disk. Unfortunately we have not come up with the perfect solution just yet, but we're working on it! In the meantime, users have been given the option to produce just the data/ directory. For those unfamiliar with JBrowse, the data/ directory contains processed data files, but no way to view them. This feature is additionally implemented for upcoming Apollo integration.
Genetic Code is a new feature in v0.4 of JiG / v1.12.0 of JBrowse, which allows users to specify a non standard genetic code, and have JBrowse highlight the correct start and stop codons.
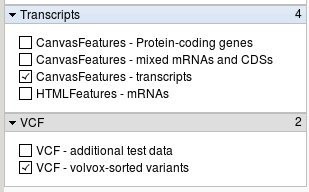
Track Groups represent a set of tracks in a single category. These can be used to let your users understand relationships between large groups of tracks.
Annotation Tracks
Within Track Groups, you have one or more Annotation Tracks. Each Annotation Track is a groups of datasets which have similar styling. This allows you to rapidly build up JBrowse instances without having to configure tracks individually. A massive improvement over previous versions. For example, if you have five different GFF3 files from various gene callers that you wish to display, you can take advantage of this feature to style all of them similarly.
There are a few different types of tracks supported, each with their own set of options:
GFF3/BED
These are your standard feature tracks. They usually highlight genes, mRNAs and other features of interest along a genomic region. The underlying tool and this help documentation focus primarily on GFF3 data, and have not been tested extensively with other formats. Automatic min/max detection will fail under BED datasets.
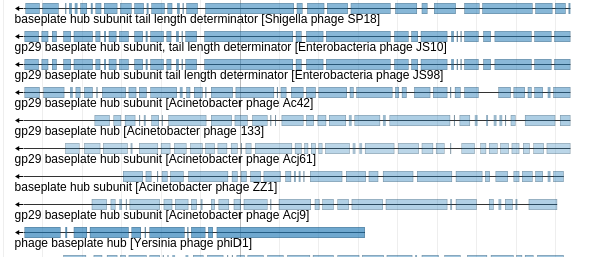
The data may be of a subclass we call match/match part data. This consists of top level match features, with a child match_part feature, and is often used in displaying alignments. (See "Alignments" section on the GFF3 specification for more information). If the data is match/match part, you will need to specify the top level match feature name, as it can be one of a few different SO terms, and JiG does not yet have the ability to understand SO terms.
Next up is the Styling Options section, which lets you control a few properties on how the track is styled. Most of these you will not need to configure and can safely leave on defaults. Occasionally you will want to change what information is shown in the end product.
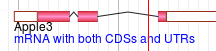
In the above image you can see some black text, and some blue text. The source of the black text is configured with the style.label option, and the source of the blue text is configured with the style.description option.
Feature Score Scaling & Colouring Options
First, you need to choose between ignoring the score attribute of GFF3 files, or using it. If you choose to ignore it, all features will be coloured with a solid colour. If you choose to use it, features will have slightly different colours based on their scores.
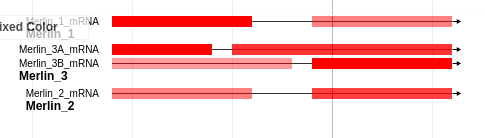
If you choose Ignore score, you may choose between automatically choosing a colour, or manually specifying one. The automatically chosen colours vary along a brewer palette and generally look quite nice with no human intervention required. The manual colour choice is somewhat self explanatory. Clicking on the small coloured square will bring up a colour palette.
If you choose Base on score, you're faced with a dizzying array of options. First is the function to map the colour choices to colour values. JiG comes with a few functions built in such as linear scaling, logarithmic scaling, and blast scaling.
The linear scaling method says "take these values, and they map directly to a range of output values". Logarithmic scaling says "please take the log of the score before mapping", and Blast scaling is further specialised to handle blast data more nicely. These are convenience functions to help transform the wide array of possible values in the GFF3 score attribute to more meaningful numbers. If you need more comprehensive score scaling, it is recommended that you pre-process your GFF3 files somehow.
Once you've selected a scaling method, you can choose to manually specify the minimum and maximum expected values, or you can let JiG determine them for you automatically.
Finally, opacity is the only mapping we currently provide. Future iterations will attempt to improve upon this and provide more colour scales. The Opacity option maps the highest scoring features to full opacity, and everything else to lower ones.
BAM Pileups
We support BAM files and can automatically generate SNP tracks based on that bam data.
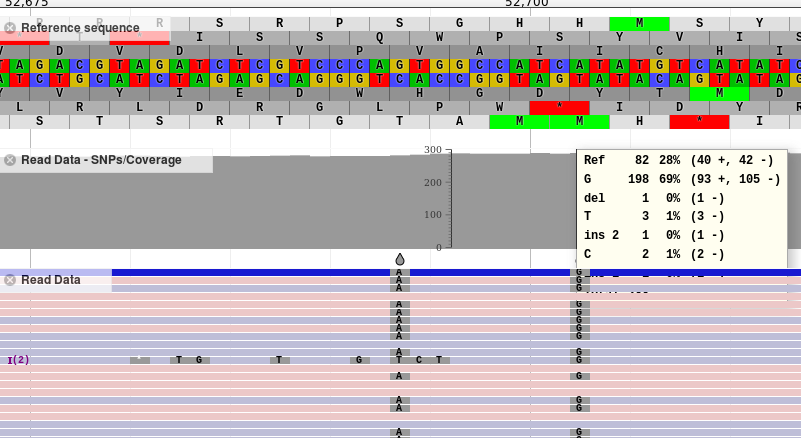
This is strongly discouraged for high coverage density datasets. Unfortunately there are no other configuration options exposed for bam files.
BlastXML
JiG now supports both blastn and blastp datasets. JiG internally uses a blastXML to gapped GFF3 tool to convert your blastxml datasets into a format amenable to visualization in JBrowse. This tool is also available separately from the IUC on the toolshed.
Minimum Gap Size reflects how long a gap must be before it becomes a real gap in the processed gff3 file. In the picture above, various sizes of gaps can be seen. If the minimum gap size was set much higher, say 100nt, many of the smaller gaps would disappear, and the features on both sides would be merged into one, longer feature. This setting is inversely proportional to runtime and output file size. Do not set this to a low value for large datasets. By setting this number lower, you will have extremely large outputs and extremely long runtimes. The default was configured based off of the author's experience, but the author only works on small viruses. It is strongly recommended that you filter your blast results before display, e.g. picking out the top 10 hits or so.
Protein blast search option merely informs underlying tools that they should adjust feature locations by 3x.
Styling Options
Please see the styling options for GFF3 datasets, they are identical.
Feature Score Scaling & Coloring Options
Please see the score scaling and colouring options for GFF3 datasets, they are identical. Remember to set your score scaling to "blast" method if you do use it.
Bigwig XY
XYPlot
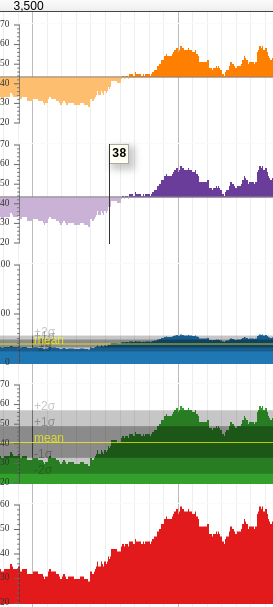
BigWig tracks can be displayed as a "density" plot which is continuous line which varies in colour, or as an "XYplot." XYplots are preferable for users to visually identify specific features in a bigwig track, however density tracks are more visually compact.
Variance Band is an option available to XYPlots, and can be seen in the third and fourth tracks in the above picture. This overlays a mean line, and 1 and 2 standard deviation areas.
Track Scaling is different from colour scaling, instead it configures how the track behaves inside of JBrowse. Autoscaling globally means that JBrowse will determine the minimum and maximum for the track, and fix the bounds of the viewport to that. E.g. if your track ranges from 1-1000, and the region you're currently zoomed to only goes from 0-50, then the viewport range will still show 1-1000. This is good for global genomic context. However you may wish to consider autoscaling locally instead. In the example of a region which varies from 0-50, autoscaling locally would cause the individual track's viewport to re-adjust and show just the 0-50 region. If neither of these options are palatable, you may manually hardcode the minimum and maximums for the track to scale to.
Colour Options
BigWig tracks have two colours in JBrowse, a positive and a negative colour.
As always you may manually choose a colour, or let JiG choose for you.
One of the more interesting options is the Bicolor pivot. This option allows you to control the point at which JBrowse switches from the positive colour to the negative. In the above graphic, you can see this has been configured to "mean" for the first two (orange and blue) tracks.
VCFs/SNPs
These tracks do not support any special configuration.
Known Issues
- More than 30 landmark features cannot be listed in the manual selector.
- Non GFF3 likely has issue with automatically determined min/max scores. Manually specify minimum and maximum score attributes, or do not use varied colours based on scores to avoid this issue.
Attribution
This Galaxy tool relies on the JBrowse, maintained by the GMOD Community. The Galaxy wrapper is developed by the IUC