What it does
This program generates plots and computes table matrix of coefficient correlations and p-values at multiple scales for the correlation between the occurrences of features in one dataset and their occurrences in another using multiscale wavelet analysis technique.
The program assumes that the user has two sets of DNA sequences, S1 and S1, each of which consists of one or more sequences of equal length. Each sequence in each set is divided into the same number of multiple intervals n such that n = 2^k, where k is a positive integer and k >= 1. Thus, n could be any value of the set {2, 4, 8, 16, 32, 64, 128, ...}. k represents the number of scales.
The program has two input files obtained as follows:
For a given set of features, say motifs, the user counts the number of occurrences of each feature in each interval of each sequence in S1 and S1, and builds two tabular files representing the count results in each interval of S1 and S1. These are the input files of the program.
The program gives two output files:
- The first output file is a TABULAR format file representing the coefficient correlations and p-values for each feature at each scale.
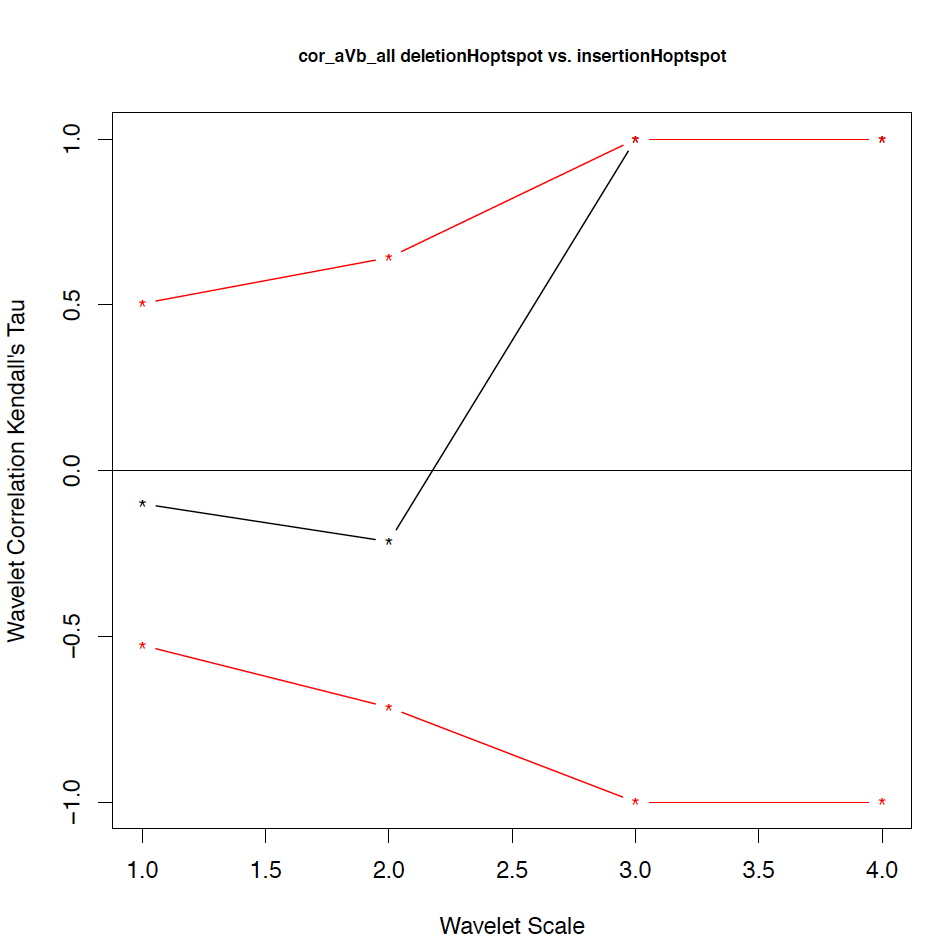
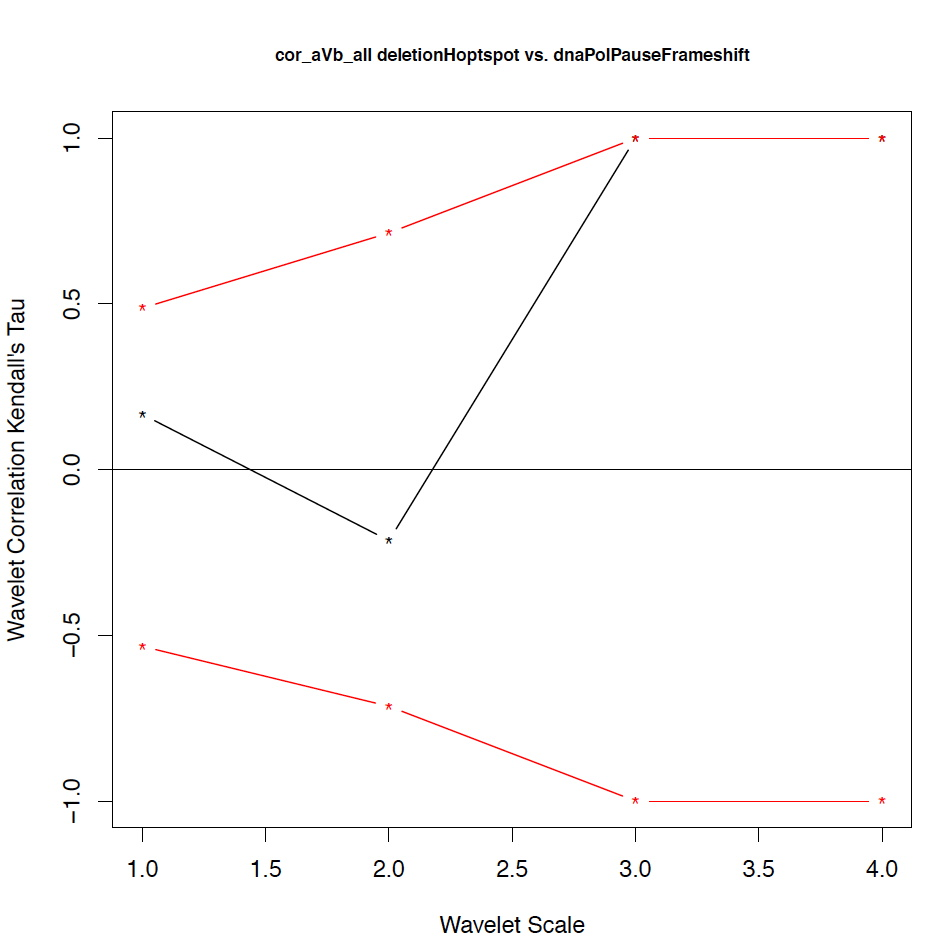
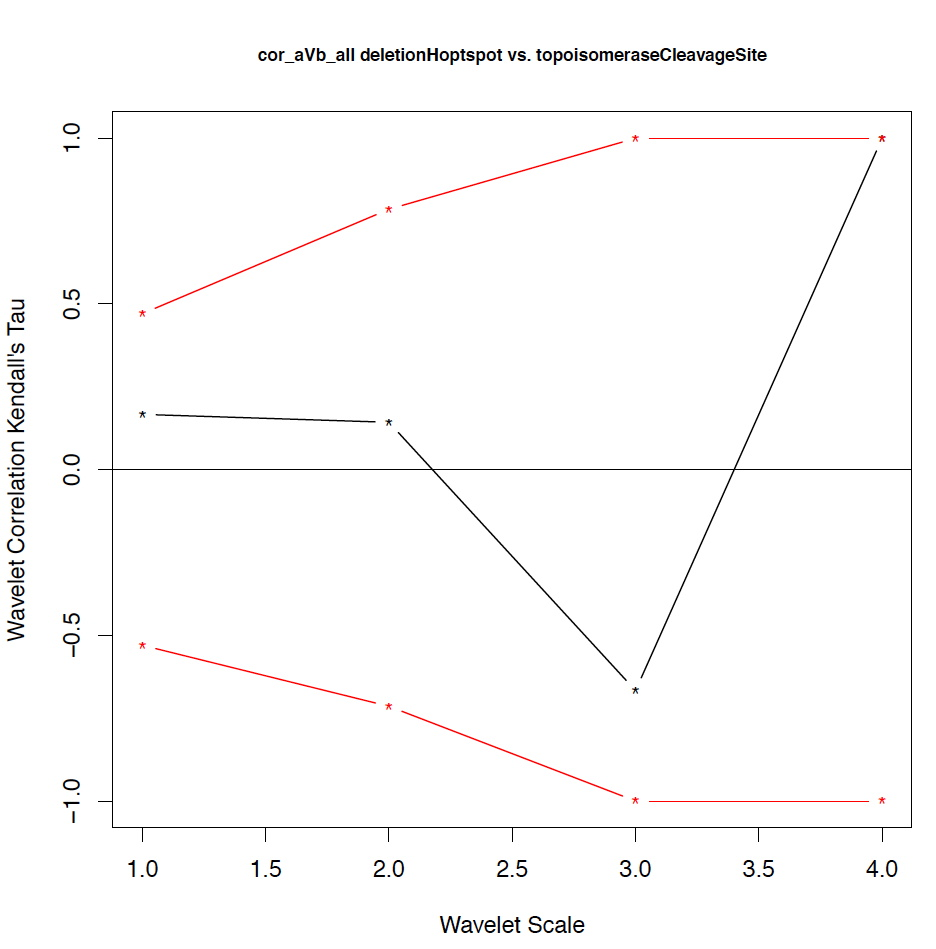
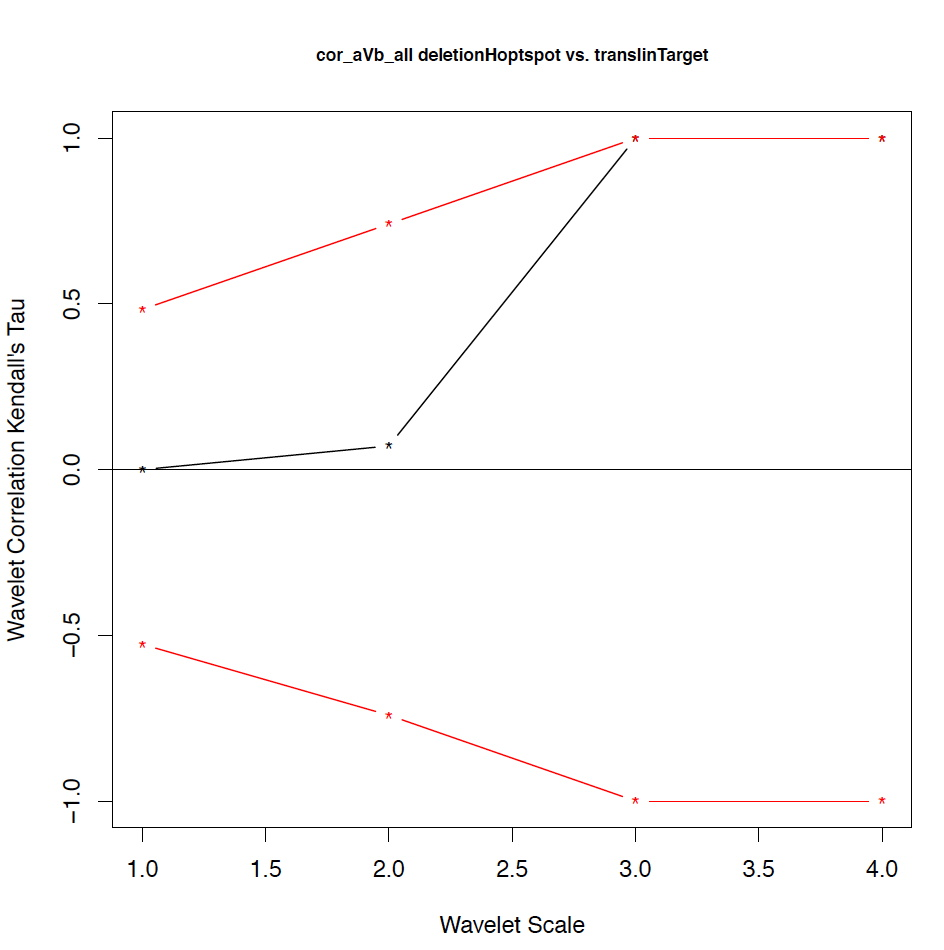
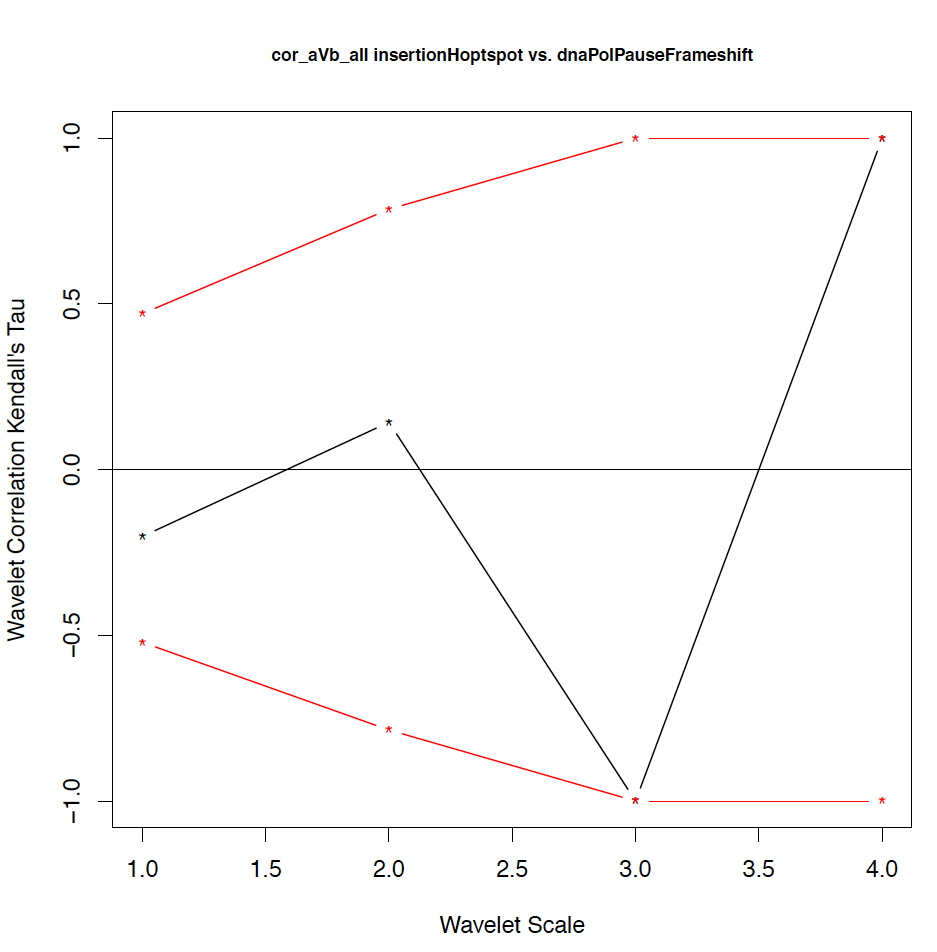
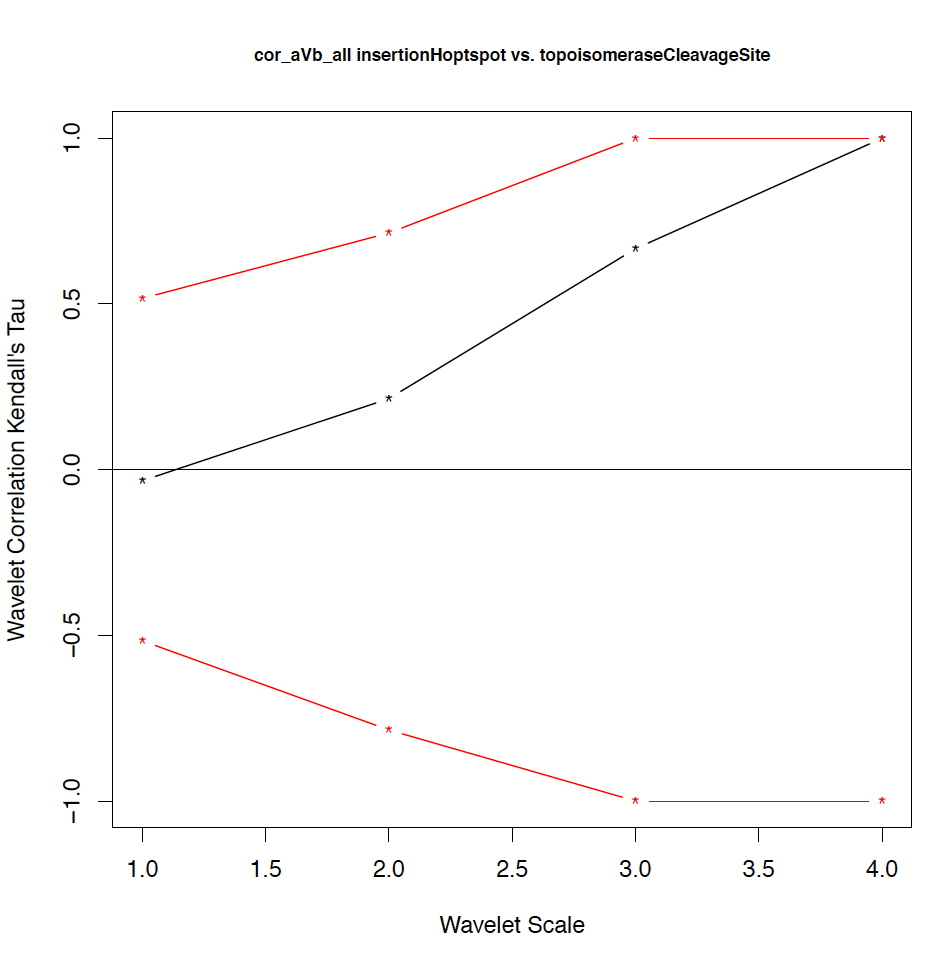
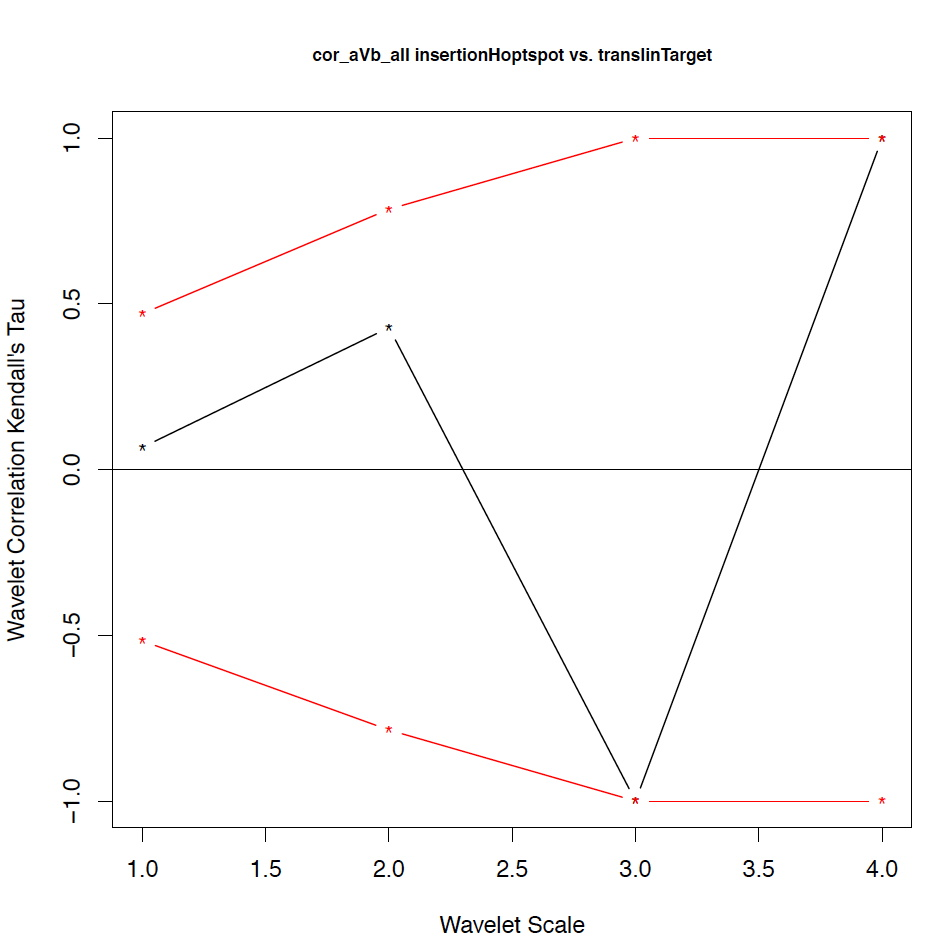
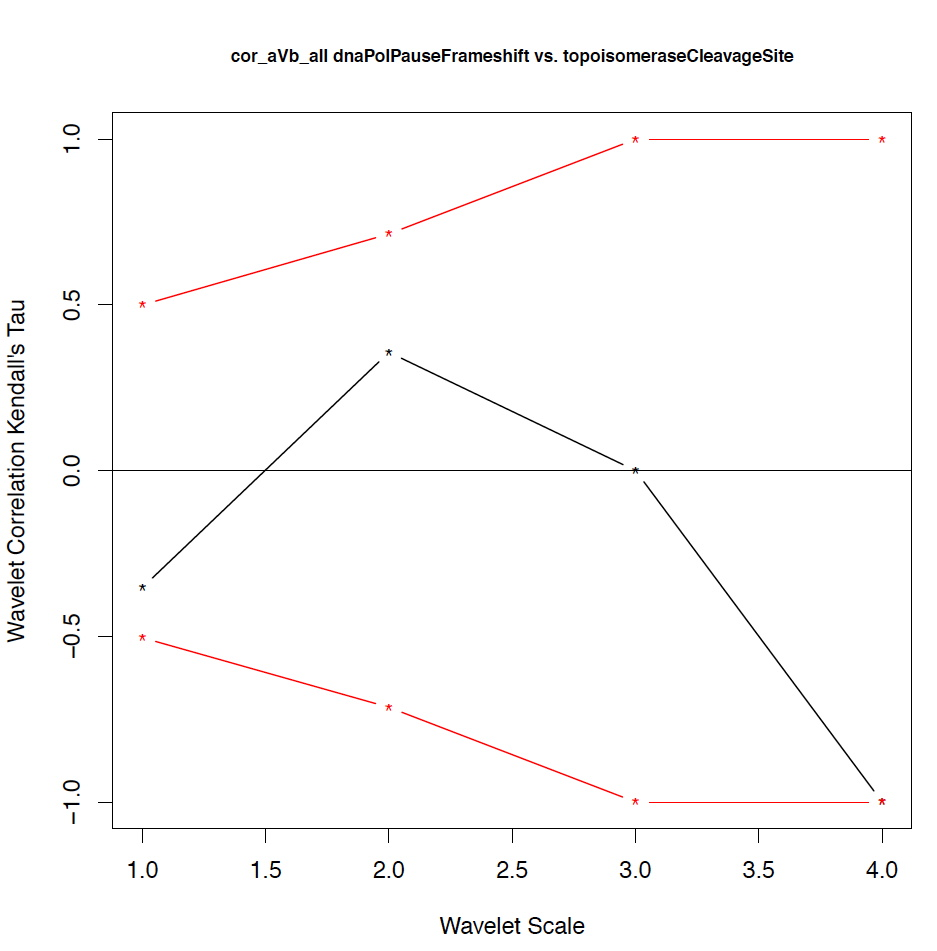
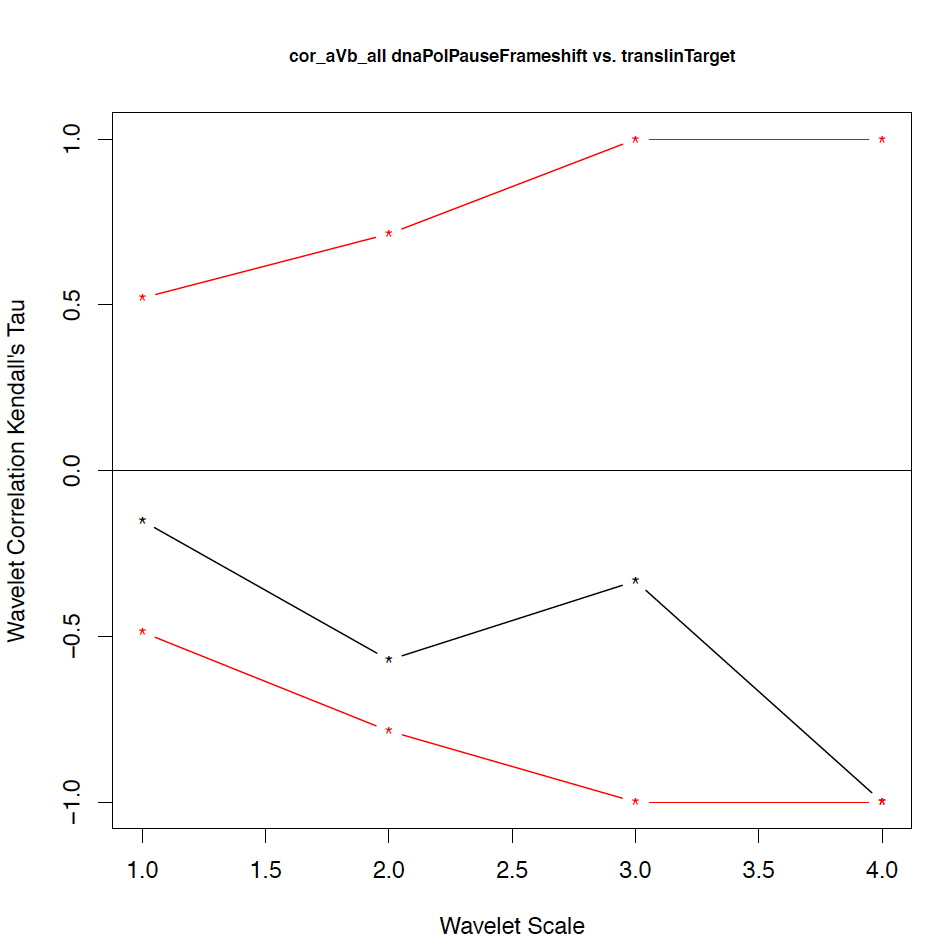
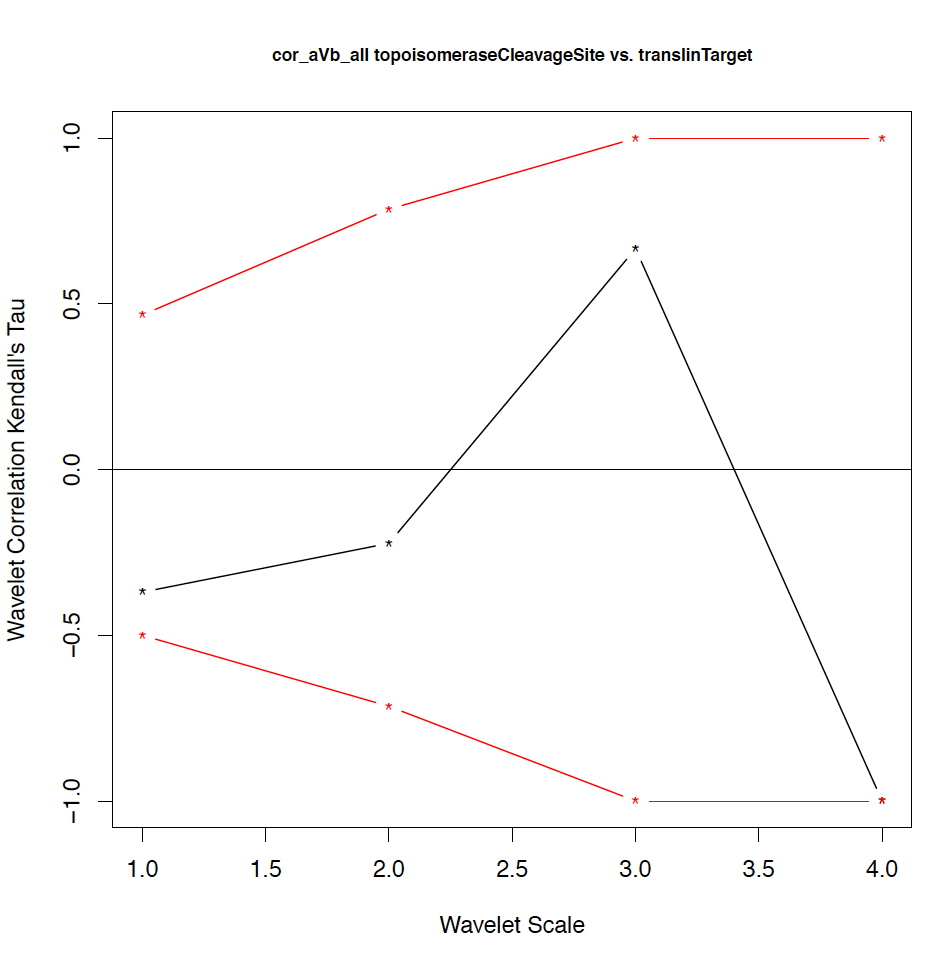
- The second output file is a PDF file consisting of as many figures as the number of features, such that each figure represents the values of the coefficient correlations for that feature at every scale.
Note
In order to obtain empirical p-values, a random perumtation test is implemented by the program, which results in the fact that the program gives slightly different results each time it is run on the same input file.
Example
Counting the occurrences of 5 features (motifs) in 16 intervals (one line per interval) of the DNA sequences in S1 gives the following tabular file:
deletionHoptspot        insertionHoptspot       dnaPolPauseFrameshift   topoisomeraseCleavageSite       translinTarget
        82                      162                     158                     79                              459
        111                     196                     154                     75                              459
        98                      178                     160                     79                              475
        113                     201                     170                     113                             436
        113                     173                     147                     95                              446
        107                     150                     155                     84                              436
        106                     166                     175                     96                              448
        113                     176                     135                     106                             514
        113                     170                     152                     87                              450
        95                      152                     167                     93                              467
        91                      171                     169                     118                             426
        84                      139                     160                     100                             459
        92                      154                     164                     104                             440
        100                     145                     154                     98                              472
        91                      161                     152                     71                              461
        117                     164                     139                     97                              463
And counting the occurrences of 5 features (motifs) in 16 intervals (one line per interval) of the DNA sequences in S2 gives the following tabular file:
deletionHoptspot        insertionHoptspot       dnaPolPauseFrameshift   topoisomeraseCleavageSite       translinTarget
        269                     366                     330                     238                             1129
        239                     328                     327                     283                             1188
        254                     351                     358                     297                             1151
        262                     371                     355                     256                             1107
        254                     361                     352                     234                             1192
        265                     354                     367                     240                             1182
        255                     359                     333                     235                             1217
        271                     389                     387                     272                             1241
        240                     305                     341                     249                             1159
        272                     351                     337                     257                             1169
        275                     351                     337                     233                             1158
        305                     331                     361                     253                             1172
        277                     341                     343                     253                             1113
        266                     362                     355                     267                             1162
        235                     326                     329                     241                             1230
        254                     335                     360                     251                             1172
We notice that the number of scales here is 4 because 16 = 2^4. Running the program on the above input files gives the following output:
The first output file:
motif1                          motif2                          1_cor           1_pval          2_cor           2_pval          3_cor           3_pval          4_cor           4_pval

deletionHoptspot                insertionHoptspot               -0.1            0.346           -0.214          0.338           1               0.127           1               0.467
deletionHoptspot                dnaPolPauseFrameshift           0.167           0.267           -0.214          0.334           1               0.122           1               0.511
deletionHoptspot                topoisomeraseCleavageSite       0.167           0.277           0.143           0.412           -0.667          0.243           1               0.521
deletionHoptspot                translinTarget                  0               0.505           0.0714          0.441           1               0.124           1               0.518
insertionHoptspot               dnaPolPauseFrameshift           -0.202          0.238           0.143           0.379           -1              0.122           1               0.517
insertionHoptspot               topoisomeraseCleavageSite       -0.0336         0.457           0.214           0.29            0.667           0.252           1               0.503
insertionHoptspot               translinTarget                  0.0672          0.389           0.429           0.186           -1              0.119           1               0.506
dnaPolPauseFrameshift           topoisomeraseCleavageSite       -0.353          0.101           0.357           0.228           0               0.612           -1              0.49
dnaPolPauseFrameshift           translinTarget                  -0.151          0.303           -0.571          0.09            -0.333          0.37            -1              1
topoisomeraseCleavageSite       translinTarget                  -0.37           0.077           -0.222          0.297           0.667           0.234           -1              0.471
The second output file: