What it does
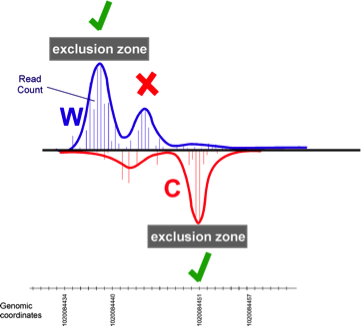
CWPair accepts one or more gff files as input and takes the peak location to be the midpoint between the exclusion zone start and end coordinate (columns D and E). CWPair starts with the highest peak (primary peak) in the dataset, and then looks on the opposite strand for another peak located within the distance defined by a combination of the tool's Distance upstream from a peak to allow a pair (the distance upstream or 5’ to the primary peak) and Distance downstream from a peak to allow a pair (the distance downstream or 3’ to the primary peak) parameters. So "upstream" value 30 "downstream" value 20 makes the tool look 30 bp upstream and 20 bp downstream (inclusive). Consequently, the search space would be 51 bp, since it includes the primary peak coordinate. The use of a negative number changes the direction of the search limits. So, "upstream" -30 and "downstream" 20 produces an 11 bp downstream search window (20-30 bp downstream, inclusive).
When encountering multiple candidate peaks within the search window, CWPair uses the resolution method defined by the tool's Method of finding a match parameter as follows:
- mode - This is an iterative process in which all peak-pair distances within the search window are determined, and the mode calculated. The pair whose distance apart is closest to the mode is then selected.
- closest - Pairs the peak that has the closest absolute distance from the primary peak.
- largest - Pairs the peak that has the highest tag count.
- all - Runs all three methods, producing separate outputs for each.
When considering the candidate peaks for pairing to a primary peak, a tag-count threshold may also be set using the tool's Filter using relative/absolute threshold parameter. A relative threshold determines the tag counts at the 95th percentile of peak occupancy (i.e. top 5% in terms of tag counts), then uses a tag count threshold at the specified percentage of this 95th percentile. So if the peak at the 95th percentile has 200 tags, and "relative threshold" 50 is used, then it will not consider any peak having less than 100 tags.
Options
- Method of finding match - Method of finding matched pair, mode, closest, largest, or all (run with each method).
- Distance upstream from a peak to allow a pair - The maximum distance (inclusive) upstream on the opposite strand from the primary peak to locate another peak, resulting in a pair.
- Distance downstream from a peak to allow a pair - The maximum distance (inclusive) downstream on the opposite strand from the primary peak to locate another peak, resulting in a pair.
- Percentage of the 95 percentile value to filter below - Percentage of the 95 percentile value below which to filter when using a relative threshold.
- Absolute value to filter below - Absolute value below which to filter when using an absolute threshold.
- Output files - Restrict output dataset collections to matched pairs only or one of several combinations of collection types.
Output Data Files
- closest/largest/mode MP - gff file containing the Matched Pairs and includes the peak-pair midpoint coordinate (column D) and the coordinate +1 (column E). The tag count sum is reported in column F, along with the C-W distance in bp in column I.
- closest/largest/mode O - tabular file containing the Orphans (all peaks that are not in pairs).
- closest/largest/mode D - tabular file containing the Details, which lists + and – strand information separately. The start and end represent the lower and higher coordinates of the exclusion zone from GeneTrack, and “Value” is the tag count sum within the exclusion zone. The peak pair midpoint is calculated along with the distance between the two paired peaks (midpoint-to-midpoint or C-W distance).
Output Statistics Files
- closest/largest/mode C - pdf file that provides the frequency distribution of peak pair distances.
- closest/largest/mode P - pdf file that provides the preview plots graph (the initial iteration of the process for finding the mode).
- closest/largest/mode F - pdf file that provides the final plots graph.
- Statistics Table - provides the number of peaks in pairs (dividing this by 2 provides the number of peak-pairs).