Comparison of Hi-C matrices
This tool is useful to compare two matrices by applying operations like difference, ratio or log2ratio after normalization. To normalize the matrices, each element is divided by the sum of the matrix.
hicCompareMatrices can be used for example to determine the effect of a mutation compared to wild-type samples on contact enrichment, or to see TAD structure modifications near differentially expressed genes between two conditions when followed by hicPlotMatrix. It can also be used to compare two biological replicates.
Usage
hicCompareMatrices is usually perfomed on corrected matrices (hicCorrectMatrix) with bins merged (hicMergeMatrixBins) depending on the downstream analyses to perform (visualisation of a whole chromosome, or of a small region, etc).
Output
Here is an example of a log2ratio comparison between M1BP Knockdown and GST cells in Drosophila melanogaster on corrected matrices with 50 bins merged (about 30kb bins) plotted using hicPlotMatrix.
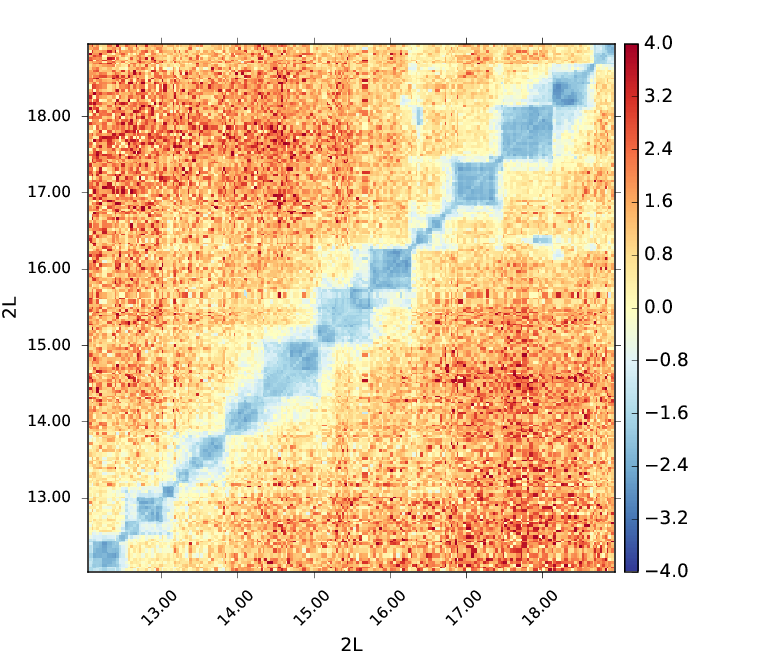
In this plot we see that the cells with a M1BP Knockdown display a negative log2ratio compared to the wild-type. Depletion of M1BP thus show a dramatic effect on the distribution of Hi-C contacts in which short range contacts decrease (Ramirez et al. 2017, High-resolution TADs reveal DNA sequences underlying genome organization in flies, https://doi.org/10.1038/s41467-017-02525-w).
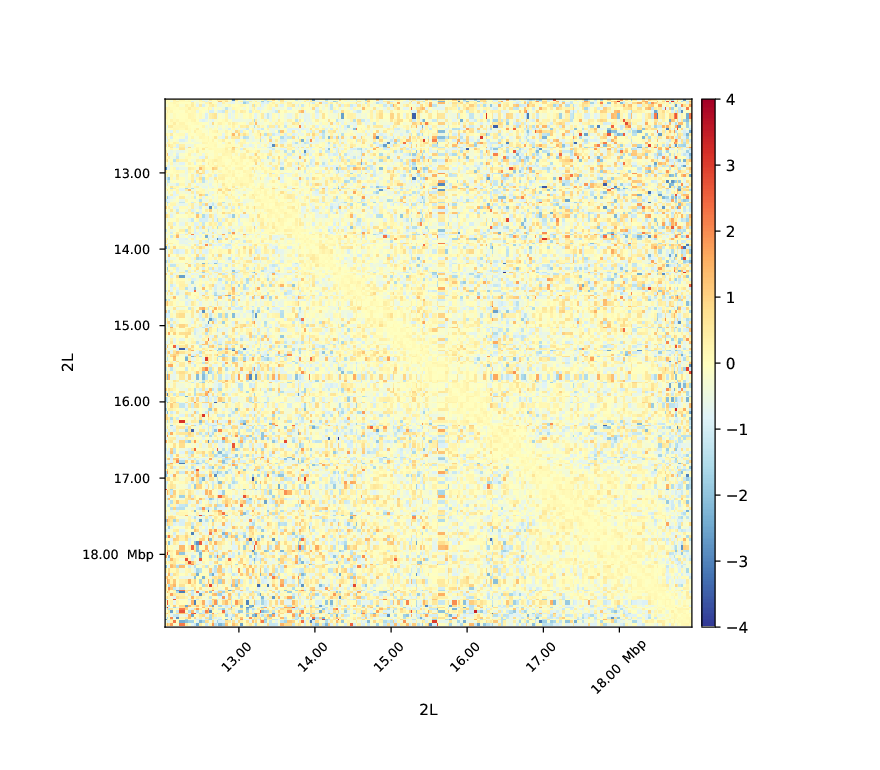
Below you can find an example of a log2ratio plot between Hi-C matrices of two biological replicates, no differences are observable which means that the replicates are well correlated.