What it does
This tool generates a matrix of read coverages for a list of genomic regions and at least two samples (BAM files). The genome is split into bins of the given size. For each bin, the number of reads found in each BAM file is counted. Alternatively, an interval file with pre-defined genomic regions can be provided.
In principle, this tool does the same as multiBigwigSummary, but for BAM files.
A typical follow-up application is to check and visualize the similarity and variability between replicates or published data sets (see: plotPCA and plotCorrelation).
Output
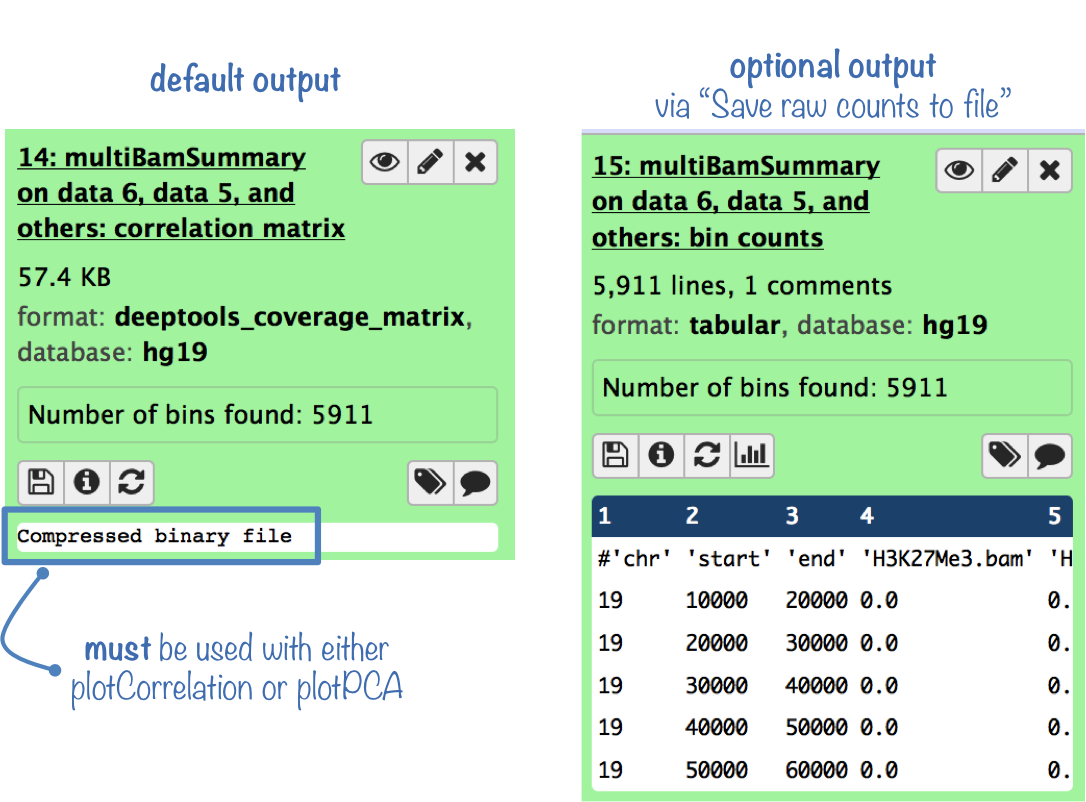
The default output is a compressed file that can only be used with plotPCA or plotCorrelation.
To analyze the coverage scores yourself, you can get the uncompressed score matrix where every row corresponds to a genomic region (or bin) and each column corresponds to a sample (BAM file). (To obtain this output file, select "Save raw counts (coverages) to file" )
For more information on the tools, please visit our help site.
For support or questions please post to Biostars. For bug reports and feature requests please open an issue on github.
This tool is developed by the Bioinformatics and Deep-Sequencing Unit at the Max Planck Institute for Immunobiology and Epigenetics.