What it does
This pipeline has been designed for the analysis of 16S rRNA data from Illumina Miseq (Casava >= 1.8) paired-end reads.
Usage
1. Preparation of the mapping file and format of unique sample id
Before using the amplicon analysis pipeline it would be necessary to follow the steps as below to avoid analysis failures and ensure samples are labelled appropriately. Sample names for the labelling are derived from the fastq files names that are generated from the sequencing. The labels will include everything between the beginning of the name and the sample number (from C11 to S19 in Fig. 1)
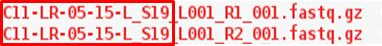
Figure 1
If analysing 16S data from multiple runs:
The samples from different runs may have identical IDs. For example, when sequencing the same samples twice, by chance, these could be at the same position in both the runs. This would cause the fastq files to have exactly the same IDs (Fig. 2).
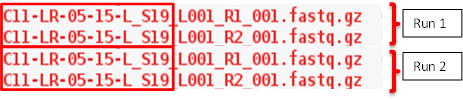
Figure 2
In case of identical sample IDs the pipeline will fail to run and generate an error at the beginning of the analysis.
To avoid having to change the file names, before uploading the files, ensure that the samples IDs are not repeated.
2. To upload the file
Click on Get Data/Upload File from the Galaxy tool panel on the left hand side.
From the pop-up window, choose how to upload the file. The Choose local file option can be used for files up to 4Gb. Fastq files from Illumina MiSeq will rarely be bigger than 4Gb and this option is recommended.
After choosing the files click Start to begin the upload. The window can now be closed and the files will be uploaded onto the Galaxy server. You will see the progress on the HISTORY panel on the right side of the screen. The colour will change from grey (queuing), to yellow (uploading) and finally green (uploaded).
Once all the files are uploaded, click on the operations on multiple datasets icon and select the fastq files that need to be analysed. Click on the tab For all selected... and on the option Build List of Dataset pairs (Fig. 3).
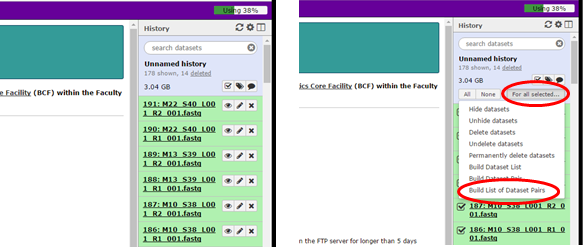
Figure 3
Change the filter parameter _1 and _2 to be _R1 and _R2. The fastq files forward R1 and reverse R2 should now appear in the corresponding columns.
Select Autopair. This creates a collection of paired fastq files for the forward and reverse reads for each sample. The name of the pairs will be the ones used by the pipeline. You are free to change the names at this point as long as they are the same used in the Metatable file (see section 3).
Name the collection and click on create list. This reduces the time required to input the forward and reverse reads for each individual sample.
3. Create the Metatable files
Metatable.txt
Click on the list of pairs you just created to see the name of the single pairs. The name of the pairs will be the ones used by the pipeline, therefore, these are the names that need to be used in the Metatable file.
The Metatable file has to be in QIIME format. You can find a description of it on QIIME website http://qiime.org/documentation/file_formats.html
EXAMPLE:
#SampleID    BarcodeSequence    LinkerPrimerSequence    Disease    Gender    Description
Mock-RUN1    TAAGGCGAGCGTAAGA                           PsA        Male      Control
Mock-RUN2    CGTACTAGGCGTAAGA                           PsA        Male      Control
Mock-RUN3    AGGCAGAAGCGTAAGA                           PsC        Female    Control
Briefly: the column LinkerPrimerSequence is empty but it cannot be deleted. The header is very important. #SampleID, Barcode, LinkerPrimerSequence and Description are mandatory. Between LinkerPrimerSequence and Description you can add as many columns as you want. For every column a PCoA plot will be created (see Results section). You can create this file in Excel and it will have to be saved as Text(Tab delimited).
During the analysis the Metatable.txt will be checked to ensure that the file has the correct format. If necessary, this will be modified and will be available as Metatable_corrected.txt in the history panel. If you are going to use the metatable file for any other statistical analyses, remember to use the Metatable_mod.txt one, otherwise the sample names might not match!
Categories.txt (optional)
This file is required if you want to get box plots for comparison of alpha diversity indices (see Results section). The file is a list (without header and IN ONE COLUMN) of categories present in the Metatable.txt file. THE NAMES YOU ARE USING HAVE TO BE THE SAME AS THE ONES USED IN THE METATABLE.TXT. You can create this file in Excel and will have to be saved as Text(Tab delimited).
EXAMPLE:
Disease
Gender
Metatable and categories files can be uploaded using Get Data as done with the fatsq files.
4. Analysis
Under Amplicon_Analysis_Pipeline
- Title Name to distinguish between the runs. It will be shown at the beginning of each output file name.
- Input Metatable.txt file Select the Metatable.txt file related to this analysis
- Input Categories.txt file (Optional) Select the Categories.txt file related to this analysis
- Input FASTQ type select Dataset pairs in a collection and, then, the collection of pairs you created earlier.
- Forward/Reverse PCR primer sequence if the PCR primer sequences have not been removed from the MiSeq during the fastq creation, they have to be removed before the analysis. Insert the PCR primer sequence in the corresponding field. DO NOT include any barcode or adapter sequence. If the PCR primers have been already trimmed by the MiSeq, and you include the sequence in this field, this would lead to an error. Only include the sequences if still present in the fastq files.
- Threshold quality below which reads will be trimmed Choose the Phred score used by Sickle to trim the reads at the 3’ end.
- Minimum length to retain a read after trimming If the read length after trimming is shorter than a user defined length, the read, along with the corresponding read pair, will be discarded.
- Minimum overlap in bp between forward and reverse reads Choose the minimum basepair overlap used by Pandaseq to assemble the reads. Default is 10.
- Minimum length in bp to keep a sequence after overlapping Choose the minimum sequence length used by Pandaseq to keep a sequence after the overlapping. This depends on the expected amplicon length. Default is 380 (used for V3-V4 16S sequencing; expected length ~440bp)
- Pipeline to use for analysis Choose the pipeline to use for OTU clustering and chimera removal. The Galaxy tool supports the Vsearch and DADA2 pipelines.
- Reference database Choose between GreenGenes, Silva or HOMD (Human Oral Microbiome Database) for taxa assignment.
Click on Execute to start the analysis.
5. Results
Results are entirely generated using QIIME scripts. The results will appear in the History panel when the analysis is completed.
The following outputs are captured:
- Vsearch_tax_OTU_table.biom|DADA2_tax_OTU_table.biom (biom format) The OTU table in BIOM format (http://biom-format.org/)
- otus.tre Phylogenetic tree constructed using make_phylogeny.py (fasttree) QIIME script (http://qiime.org/scripts/make_phylogeny.html)
- Phylum_genus_dist_barcharts_HTML HTML file with bar charts at Phylum, Genus and Species level (http://qiime.org/scripts/summarize_taxa.html and http://qiime.org/scripts/plot_taxa_summary.html)
- OTUs_count_file Summary of OTU counts per sample (http://biom-format.org/documentation/summarizing_biom_tables.html)
- Table_summary_file Summary of sequences counts per sample (http://biom-format.org/documentation/summarizing_biom_tables.html)
- multiplexed_linearized_dereplicated_mc2_repset_nonchimeras_OTUs.fasta|seqs.fa Fasta file with OTU sequences (Vsearch|DADA2)
- Heatmap_PDF OTU heatmap in PDF format (http://qiime.org/1.8.0/scripts/make_otu_heatmap_html.html )
- Vsearch_beta_diversity_weighted_2D_plots_HTML PCoA plots in HTML format using weighted Unifrac distance measure. Samples are grouped by the column names present in the Metatable file. The samples are firstly rarefied to the minimum sequencing depth (http://qiime.org/scripts/beta_diversity_through_plots.html )
- Vsearch_beta_diversity_unweighted_2D_plots_HTML PCoA plots in HTML format using Unweighted Unifrac distance measure. Samples are grouped by the column names present in the Metatable file. The samples are firstly rarefied to the minimum sequencing depth (http://qiime.org/scripts/beta_diversity_through_plots.html )
Code availability
Code is available at https://github.com/MTutino/Amplicon_analysis
Credits
Pipeline author: Mauro Tutino
Galaxy tool: Peter Briggs