This tool offers data transformation options, optional automated gating of debris using flowDensity and conversion of FCS files to text.
Input files
This tool uses FCS files as input and files are processed serially. Users choose which transformation algorithm to apply, and whether to automatically gate cellular debris, and/or compensate the data.
Output files
Output is a table of fluorescence intensity values for each marker, as a text file, FCS3.0 or R Object (flowFrame).
Gating output
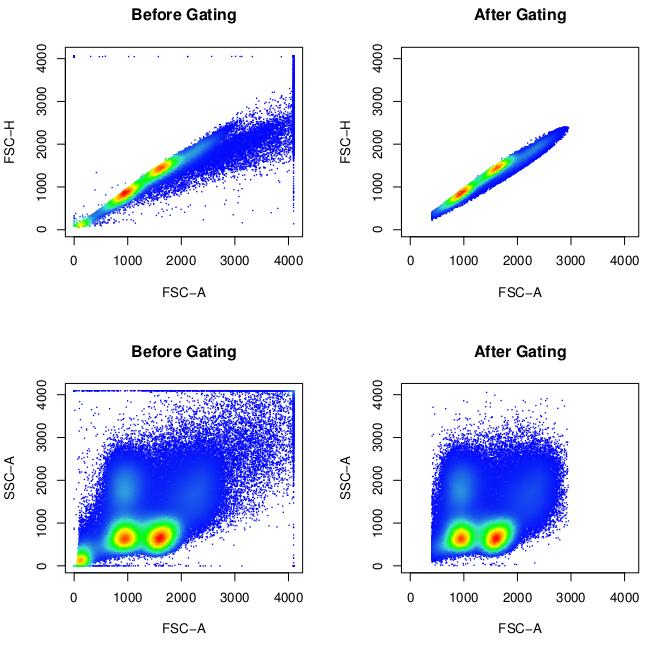
Automatically gated output includes a summary of data pre- and post-gating as well as density scatter plots pre- and post- gating for each marker pair. Please check to make sure the gating is doing what you think it should be doing.
Compensation will be implemented according to the spillover matrix included in the FCS files (if available).
Transformation
This tools currently supports 3 transformation algorithms: FCSTrans, arcsinh and logicle. The latter two are implemented using flowCore, FCSTrans is documented in the paper cited below. Transformation algorithms are NOT applied to FSC and SSC channels.
Automated Gating
Automated gating is implemented with flowDensity. Cellular debris removal uses gate coordinates calculated based on the density of the forward scatter channel only. The calculated gate is vertical and located at the largest value of either the 0.1 quantile of the FSC density or the lowest density between the first and second density peaks. Cells smaller than the threshold are removed.
Users should verify whether data benefit from being gated. We recommend evaluating the number of events and scatter plots pre- and post-gating.
Example
Output text file:
Forward Scatter Side Scatter Marker1 Marker2 Marker3 Marker4 ...
449             157          551     129     169     292     ...
894             1023         199     277     320     227     ...
262             73           437     69      0       146     ...
340             115          509     268     0       74      ...
...             ...          ...     ...     ...     ...     ...
Gating summary:
=========================
==    BEFORE GATING    ==
=========================
    events parameters
    203584         13
        FSC-A FSC-H SSC-A  SSC-H APC-A APC-H7-A FITC-A PerCP-Cy5-5-A V450-A V500-A   PE-A PE-Cy7-A  Time
Min.        0    78     0    0.0     0      0.0      0             0      0      0    0.0        0     0
1st Qu.   869   769   544  514.0   940      0.0   1023           826    978   1104  358.8      913  4182
Median   1234  1081   754  704.0  1750     31.0   1247          1614   1971   1505 1612.0     1791  8392
Mean     1304  1108  1002  863.6  1629    812.8   1329          1597   1694   1765 1376.0     1813  8536
3rd Qu.  1675  1474  1240 1087.0  2326   1573.0   1629          2565   2326   2640 2261.0     2782 12760
Max.     4095  4061  4095 4012.0  4096   4086.0   4094          4022   4091   4096 4093.0     4096 17740

=========================
==    AFTER  GATING    ==
=========================
    events parameters
    171547         13
        FSC-A FSC-H  SSC-A  SSC-H APC-A APC-H7-A FITC-A PerCP-Cy5-5-A V450-A V500-A PE-A PE-Cy7-A  Time
Min.      403   219    1.0    4.0     0      0.0      0             0      0      0    0        0     0
1st Qu.   949   849  599.0  565.0   979      0.0   1063           943   1203   1119  444     1060  4182
Median   1348  1170  782.0  730.0  1809      0.0   1258          1717   2082   1493 1785     1883  8358
Mean     1353  1177  989.2  885.9  1642    779.4   1330          1678   1778   1753 1458     1873  8504
3rd Qu.  1670  1475 1204.0 1076.0  2322   1559.0   1591          2623   2345   2630 2289     2808 12700
Max.     2953  2406 4055.0 3329.0  4069   4080.0   3498          3868   3612   4076 4093     3764 17730
Gating plots: