What it does
FROGS Clusters stat computes several metrics and generates a HTML file describing clusters based on abundances, samples, ...
Input/output
Input
Abundance file:
The abundance of each cluster in each sample (format BIOM).
The FROGS's tools working on clusters and others metagenomic workflows produce files in BIOM format.
Output
Summary file (summary.html):
Clusters metrics (format HTML):
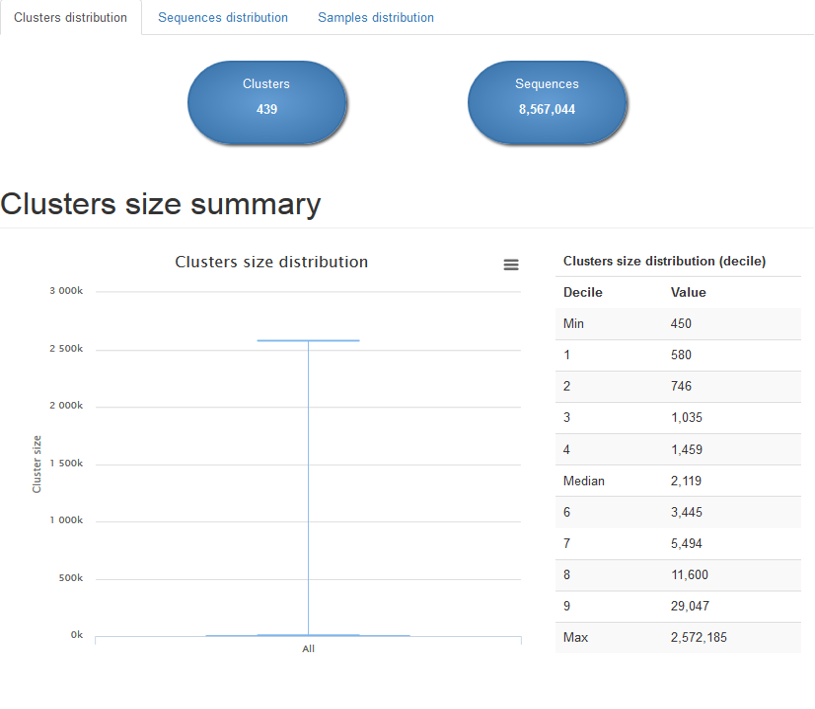
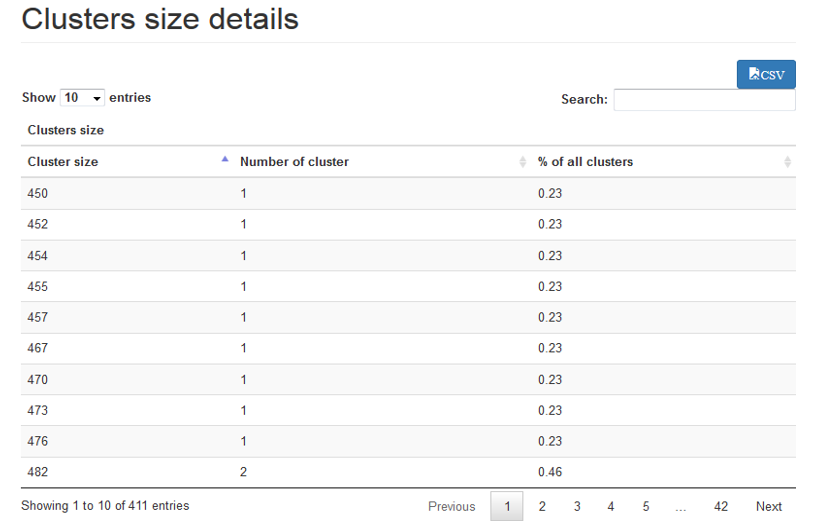
Clusters distribution : describes the sizes distribution of all clusters thank to boxplot and tables
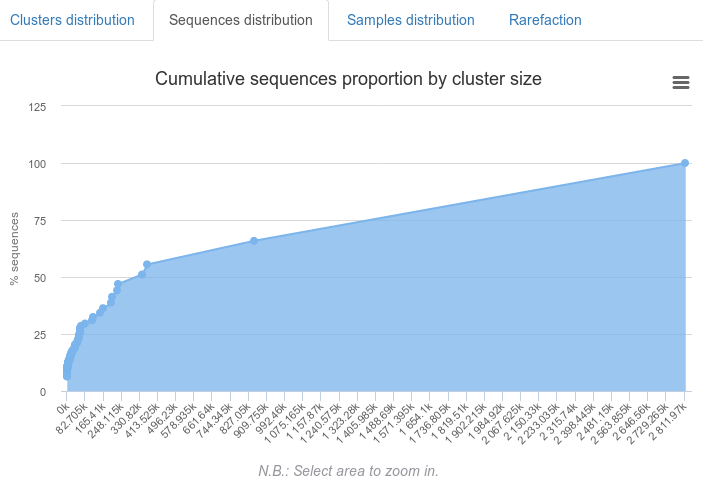
Sequences distributions : describes the sequences distribution among clusters
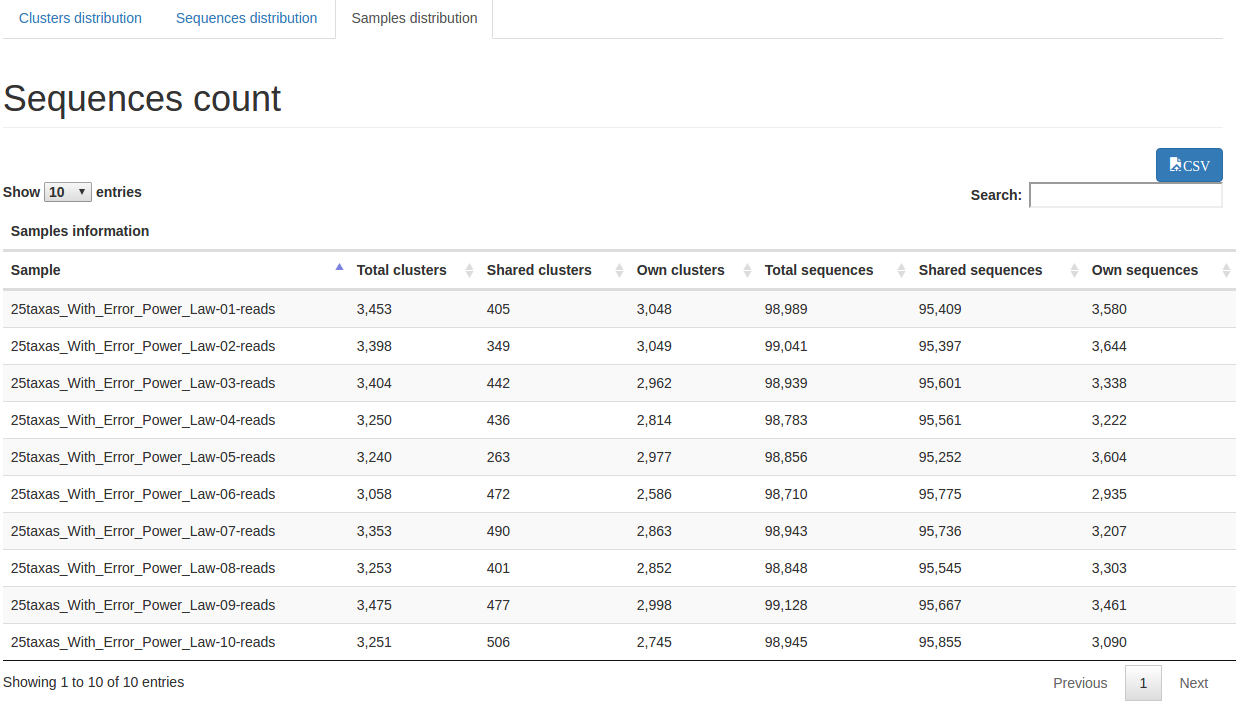
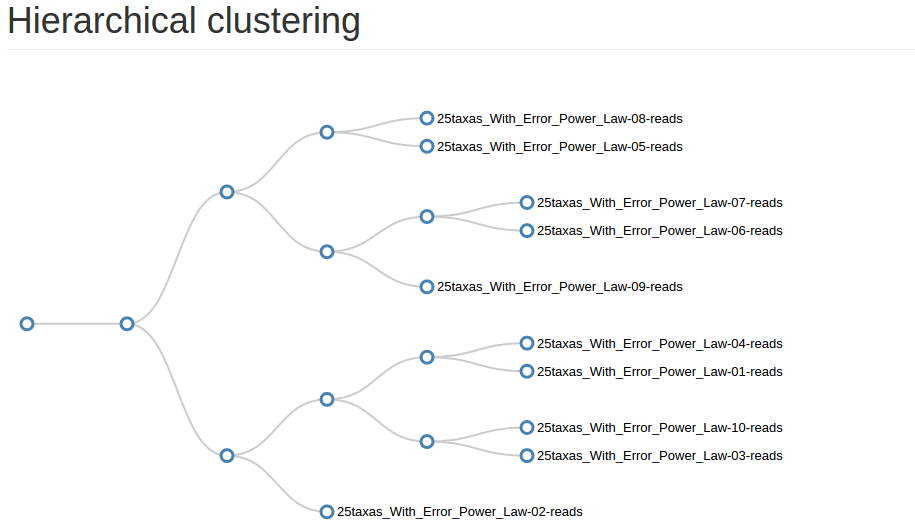
Samples distribution : describes clusters distribution among sample and give an hierarchical clustering on samples abundance profile (distance method = braycurtis, linkage method = average)
Advices
This is a very usefull tool to see the evolution of your OTU. Do not hesitate to run this tool after each FROGS step beginning at the clustering step.
Contact
Contacts: frogs@inra.fr
Repository: https://github.com/geraldinepascal/FROGS website: http://frogs.toulouse.inra.fr/
Please cite the FROGS article: Escudie F., et al. Bioinformatics, 2018. FROGS: Find, Rapidly, OTUs with Galaxy Solution.