What it does
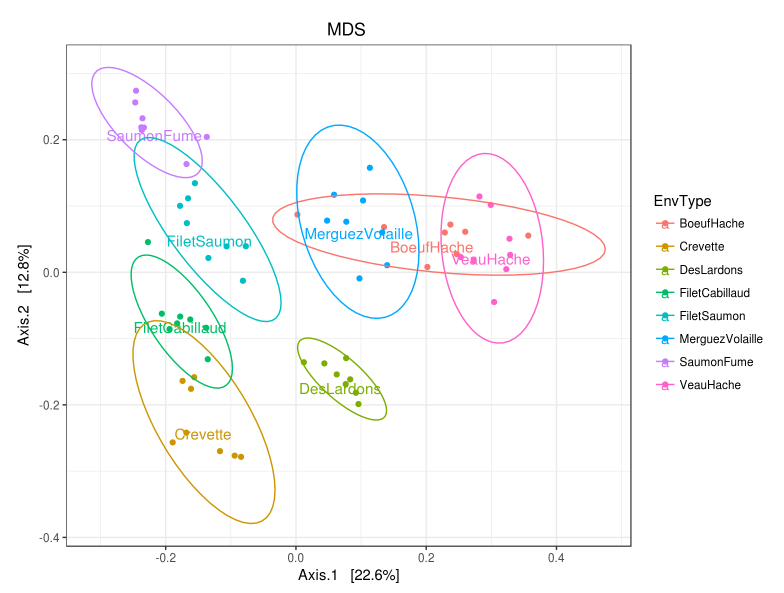
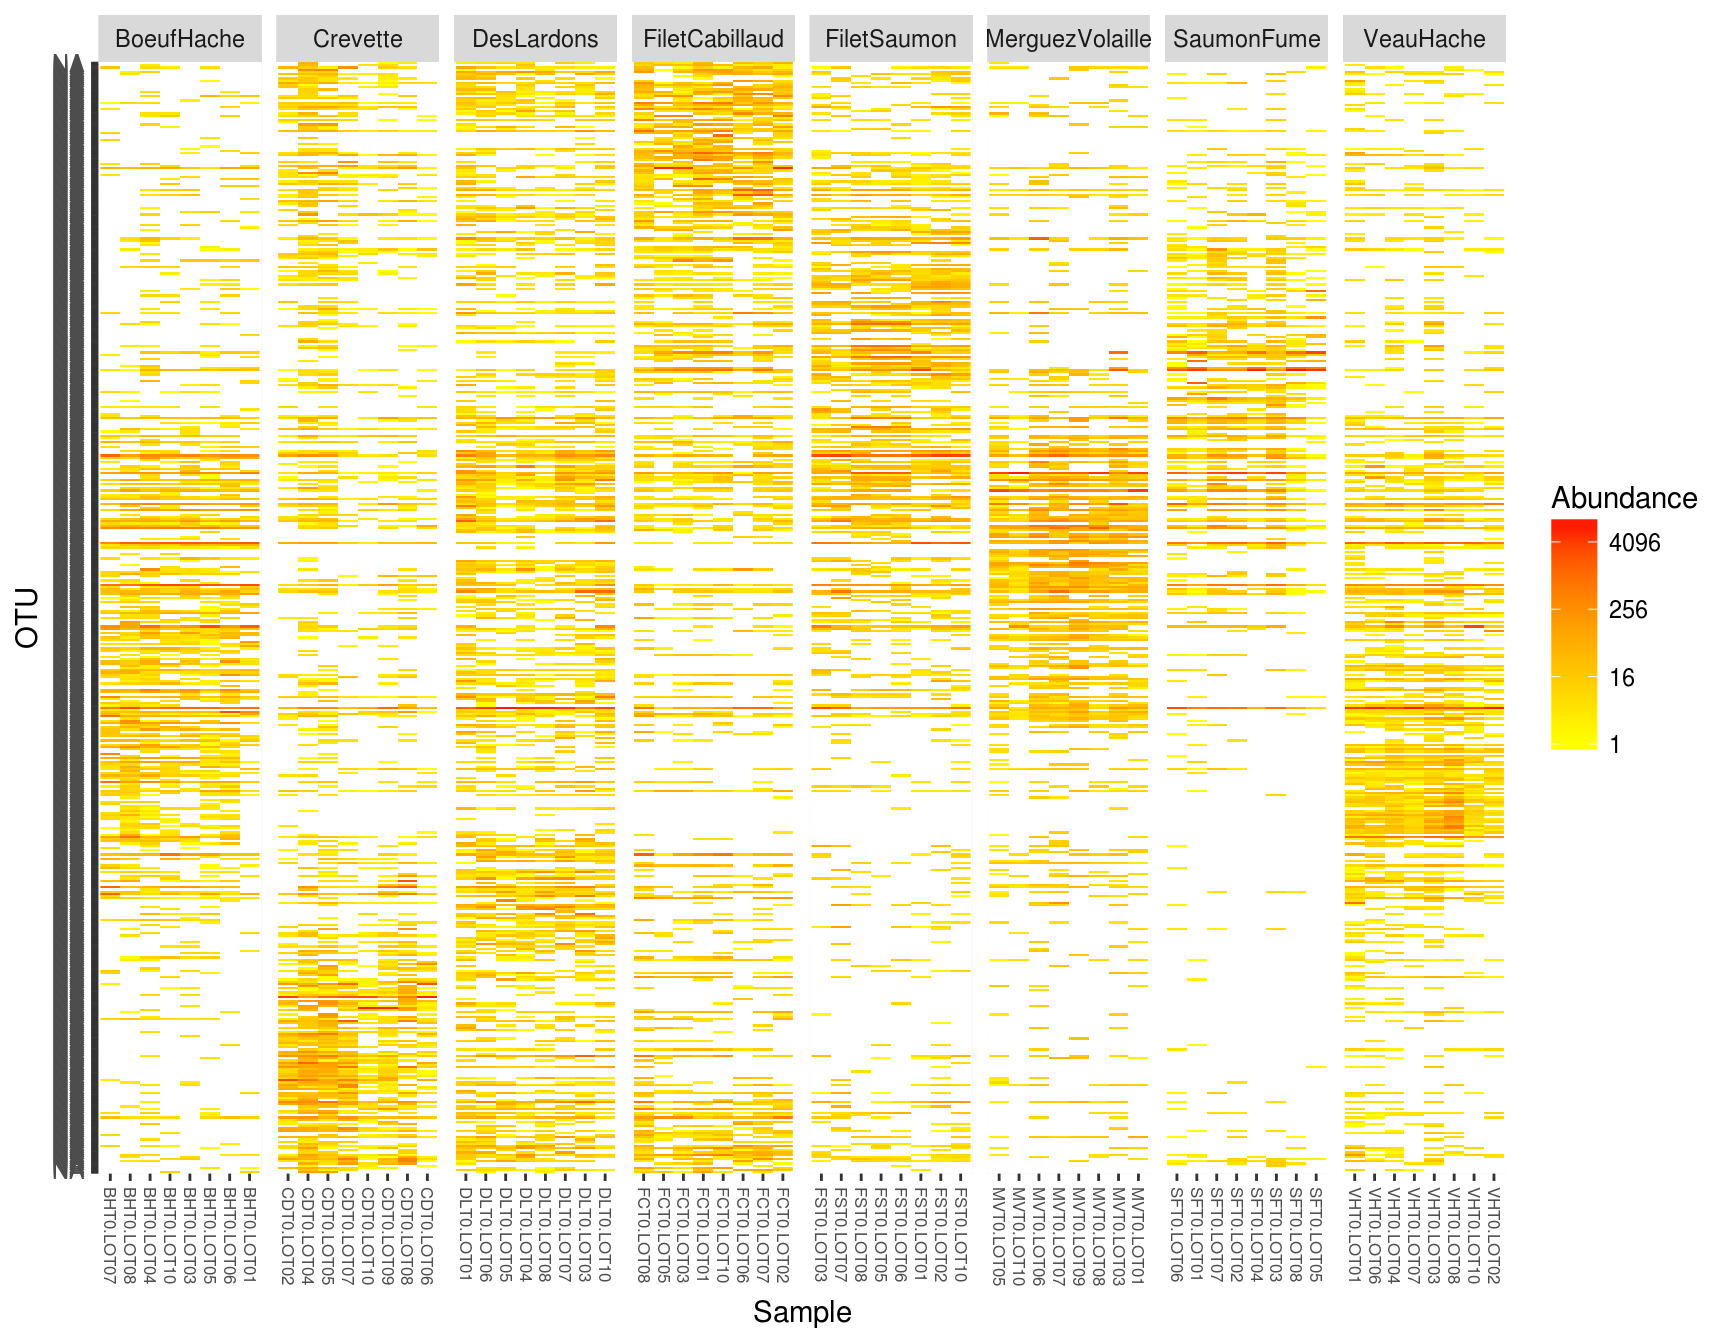
Using phyloseq and customized R function, this tool constructs heatmap plot and ordination plot with the ordination methods to visualise data structure.
Inputs/Outputs
Input
data file (format rdata): The informations of data in one phyloseq object. This file is the result of "FROGS Phyloseq Import Data tool".
distance file (format tabular): The data file containing beta diversity distance matrix. This file is the result of "FROGS Phyloseq Beta Diversity tool".
Output
html file (format HTML):
The review of data structure with an ordination plot and with an heatmap plot:
Contact
Contacts: frogs@inra.fr
Repository: https://github.com/geraldinepascal/FROGS website: http://frogs.toulouse.inra.fr/
Please cite the FROGS article: Escudie F., et al. Bioinformatics, 2018. FROGS: Find, Rapidly, OTUs with Galaxy Solution.